|
Download Data (XLS File) |
|
||||||||
|
||||||||
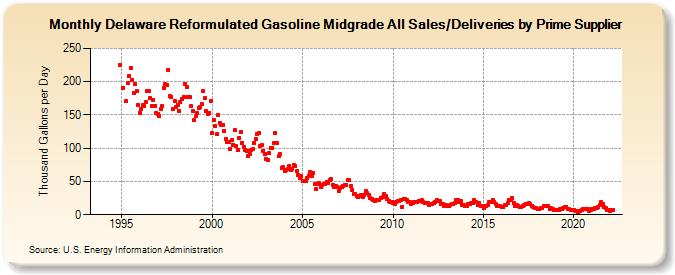
| Delaware Reformulated Gasoline Midgrade All Sales/Deliveries by Prime Supplier (Thousand Gallons per Day) | ||||||||
| Year | Jan | Feb | Mar | Apr | May | Jun | Jul | Aug | Sep | Oct | Nov | Dec |
|---|---|---|---|---|---|---|---|---|---|---|---|---|
| 1993 | - | - | - | |||||||||
| 1994 | - | - | - | - | - | - | - | - | - | - | W | 224.3 |
| 1995 | W | 190.7 | W | 170.5 | 197.4 | 208.0 | 220.7 | 203.1 | 182.5 | 196.4 | 185.9 | 165.5 |
| 1996 | 153.1 | 158.3 | 164.5 | 163.5 | 169.5 | 185.5 | 185.7 | 174.7 | 163.0 | 172.4 | 163.8 | 153.6 |
| 1997 | 151.5 | 149.0 | 159.6 | 163.2 | 190.6 | 196.0 | 194.8 | 217.9 | 178.1 | 176.7 | 158.5 | 171.1 |
| 1998 | 162.6 | 165.4 | 156.4 | 169.6 | 174.5 | 177.4 | 196.8 | 191.5 | 176.4 | 176.4 | 163.4 | 156.5 |
| 1999 | 142.6 | 149.0 | 152.6 | 160.7 | 162.3 | 166.4 | 185.8 | 174.9 | 155.6 | 151.5 | 153.2 | 171.2 |
| 2000 | 122.2 | 142.1 | 133.6 | 121.2 | 150.5 | 138.3 | 135.4 | 134.2 | 125.7 | 114.2 | 109.9 | 108.6 |
| 2001 | 99.0 | 111.9 | 105.3 | 127.3 | 103.0 | 97.9 | 116.0 | 124.5 | 108.5 | 102.2 | 96.6 | 95.2 |
| 2002 | 88.0 | 91.0 | 97.8 | 98.2 | 108.3 | 113.9 | 120.6 | 122.3 | 104.0 | 104.2 | 96.2 | 91.3 |
| 2003 | 83.0 | 82.6 | 92.6 | 100.3 | 100.9 | 107.1 | 122.5 | 107.5 | 87.8 | 90.6 | 70.8 | 71.0 |
| 2004 | 65.9 | 67.7 | 68.9 | 73.0 | 67.0 | 69.0 | 74.8 | 73.1 | 65.7 | 60.1 | 54.5 | 58.3 |
| 2005 | 50.2 | 50.5 | 50.9 | 55.4 | 58.9 | 63.8 | 58.6 | 63.2 | 45.9 | 38.9 | 45.7 | 47.7 |
| 2006 | 41.1 | 45.2 | 46.9 | 46.5 | 49.9 | 48.2 | 51.8 | 53.4 | 45.3 | 41.4 | 43.1 | 41.7 |
| 2007 | 35.6 | 39.5 | 42.0 | 43.9 | 44.9 | 45.2 | 52.1 | 52.3 | 43.1 | 37.7 | 31.5 | 30.9 |
| 2008 | 28.5 | 26.2 | 28.5 | 29.5 | 27.0 | 29.6 | 35.5 | 32.1 | 30.3 | 25.4 | 24.2 | 21.5 |
| 2009 | 21.0 | 22.7 | 22.3 | 22.6 | 25.5 | 26.2 | 31.3 | 28.8 | 23.8 | 20.4 | 19.8 | 18.4 |
| 2010 | 17.3 | 16.8 | 19.2 | 20.4 | 21.1 | 22.7 | 11.3 | 24.3 | 23.3 | 21.4 | 19.8 | 19.0 |
| 2011 | 16.7 | 17.8 | 18.9 | 19.2 | 19.6 | 21.3 | 19.9 | 21.5 | 18.5 | 18.2 | 17.4 | 17.2 |
| 2012 | 14.9 | 16.4 | 16.4 | 17.7 | 18.6 | 22.1 | 19.9 | 21.1 | 16.0 | 16.1 | 13.5 | 14.4 |
| 2013 | 13.2 | 13.5 | 14.5 | 16.1 | 16.8 | 17.9 | 21.8 | 21.7 | 19.0 | 20.1 | 14.1 | 14.1 |
| 2014 | 12.8 | 13.3 | 15.9 | 16.3 | 18.1 | 18.1 | 21.4 | 19.4 | 14.5 | 17.3 | 12.4 | 13.4 |
| 2015 | 10.5 | 13.1 | 13.6 | 14.4 | 19.1 | 19.0 | 22.0 | 19.7 | 16.3 | 13.8 | 13.2 | 12.4 |
| 2016 | 10.9 | 10.9 | 14.1 | 14.0 | 17.7 | 22.7 | 22.8 | 25.6 | 17.3 | 13.3 | 13.9 | 13.0 |
| 2017 | 11.0 | 11.1 | 13.3 | 14.3 | 16.8 | 15.4 | 17.9 | 15.9 | 13.3 | 11.8 | 10.3 | 9.4 |
| 2018 | 8.5 | 8.3 | 10.8 | 9.6 | 13.6 | 13.5 | 13.5 | 12.4 | 9.3 | 9.5 | 8.2 | 7.0 |
| 2019 | 7.2 | 6.6 | 7.2 | 8.2 | 8.2 | 9.4 | 12.0 | 11.8 | 8.8 | 8.0 | 7.5 | 7.2 |
| 2020 | 7.0 | 6.3 | 5.4 | 4.6 | 5.3 | 7.5 | 8.3 | 8.8 | 9.0 | 7.9 | 6.1 | 6.4 |
| 2021 | 8.5 | 8.3 | 10.0 | 10.5 | 11.6 | 15.2 | 18.5 | 16.3 | 11.5 | 9.5 | 6.4 | 7.1 |
| 2022 | 5.5 | 6.9 | 6.5 | |||||||||
| - = No Data Reported; -- = Not Applicable; NA = Not Available; W = Withheld to avoid disclosure of individual company data. |
| Release Date: 5/19/2022 |
| Next Release Date: TBD |