|
Download Data (XLS File) |
|
||||||||
|
||||||||
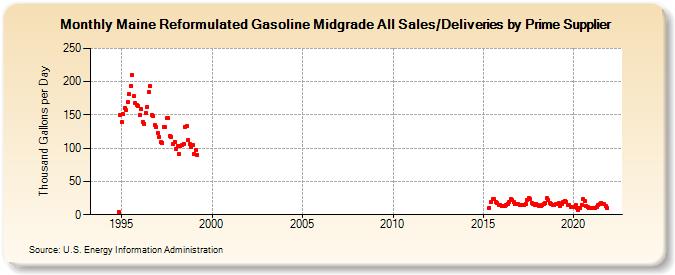
| Maine Reformulated Gasoline Midgrade All Sales/Deliveries by Prime Supplier (Thousand Gallons per Day) | ||||||||
| Year | Jan | Feb | Mar | Apr | May | Jun | Jul | Aug | Sep | Oct | Nov | Dec |
|---|---|---|---|---|---|---|---|---|---|---|---|---|
| 1993 | - | - | - | |||||||||
| 1994 | - | - | - | - | - | - | - | - | - | - | 4.2 | 150.6 |
| 1995 | 139.3 | 151.2 | 160.4 | 156.8 | 169.0 | 181.1 | 194.0 | 210.4 | 177.8 | 167.4 | 164.9 | 163.5 |
| 1996 | 150.2 | 158.8 | 139.1 | 136.9 | 153.5 | 162.4 | 184.5 | 193.2 | 150.6 | 148.1 | 134.4 | 131.6 |
| 1997 | 122.5 | 117.4 | 109.6 | 108.2 | 132.5 | 132.2 | 145.2 | 145.3 | 118.7 | 117.4 | 106.2 | 109.7 |
| 1998 | 99.2 | 103.5 | 91.6 | 102.6 | 104.7 | 106.9 | 132.3 | 133.4 | 112.1 | 106.5 | 101.7 | 105.3 |
| 1999 | 91.2 | 97.5 | 89.7 | W | W | W | - | - | - | - | - | W |
| 2000 | W | W | W | - | - | - | - | - | - | - | - | - |
| 2001 | - | - | - | - | - | - | - | - | - | - | - | - |
| 2002 | - | - | - | - | - | - | - | - | - | - | - | - |
| 2003 | - | - | - | - | - | - | - | - | - | - | - | - |
| 2004 | - | - | - | - | - | - | - | - | - | - | - | - |
| 2005 | - | - | - | - | - | - | - | - | - | - | - | - |
| 2006 | - | - | - | - | - | - | - | - | - | - | - | - |
| 2007 | - | - | - | - | - | - | - | - | - | - | - | - |
| 2008 | - | - | - | - | - | - | - | - | - | - | - | - |
| 2009 | - | - | - | - | - | - | - | - | - | - | - | - |
| 2010 | - | - | - | - | - | - | - | - | - | - | - | - |
| 2011 | - | - | - | - | - | - | - | - | - | - | - | - |
| 2012 | - | - | - | - | - | - | - | - | - | - | - | - |
| 2013 | - | - | - | - | - | - | - | - | - | - | - | - |
| 2014 | - | - | - | - | - | - | - | - | - | - | - | - |
| 2015 | - | - | - | W | 10.8 | 19.4 | 23.5 | 23.5 | 18.6 | 16.9 | 14.9 | 14.4 |
| 2016 | 12.8 | 13.3 | 13.1 | 14.3 | 16.5 | 19.4 | 23.7 | 22.7 | 18.9 | 16.4 | 15.6 | 15.6 |
| 2017 | 14.2 | 14.1 | 14.1 | 14.2 | 16.7 | 22.1 | 24.9 | 23.7 | 18.1 | 16.7 | 14.9 | 15.4 |
| 2018 | 14.0 | 13.4 | 13.5 | 14.0 | 16.3 | 18.2 | 24.8 | 22.3 | 18.2 | 16.7 | 14.9 | 14.6 |
| 2019 | 15.4 | 16.8 | 17.2 | 13.4 | 16.5 | 19.6 | 21.2 | 19.6 | 14.9 | 13.9 | 12.1 | 11.8 |
| 2020 | 11.7 | 14.3 | 10.7 | 6.7 | 10.5 | 14.9 | 23.1 | 20.5 | 13.7 | 11.6 | 9.9 | 10.1 |
| 2021 | 9.5 | 10.3 | 10.5 | 11.7 | 14.5 | 15.8 | 18.0 | W | 15.6 | 12.8 | 10.5 | W |
| 2022 | W | W | W | |||||||||
| - = No Data Reported; -- = Not Applicable; NA = Not Available; W = Withheld to avoid disclosure of individual company data. |
| Release Date: 5/19/2022 |
| Next Release Date: TBD |