|
Download Data (XLS File) |
|
||||||||
|
||||||||
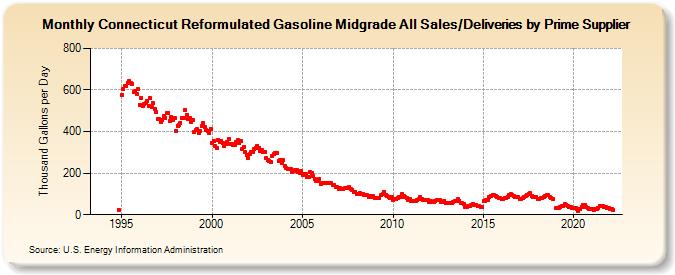
| Connecticut Reformulated Gasoline Midgrade All Sales/Deliveries by Prime Supplier (Thousand Gallons per Day) | ||||||||
| Year | Jan | Feb | Mar | Apr | May | Jun | Jul | Aug | Sep | Oct | Nov | Dec |
|---|---|---|---|---|---|---|---|---|---|---|---|---|
| 1993 | - | - | - | |||||||||
| 1994 | - | - | - | - | - | - | - | - | - | - | 23.3 | W |
| 1995 | 578.0 | 603.6 | 618.7 | 620.6 | 635.2 | 643.8 | 632.0 | 630.3 | 592.2 | 593.1 | 582.7 | 603.8 |
| 1996 | 529.5 | 561.4 | 524.3 | 532.2 | 535.7 | 544.9 | 523.8 | 561.0 | 519.0 | 536.8 | 510.0 | 492.8 |
| 1997 | 462.0 | 458.5 | 447.1 | 457.9 | 474.4 | 467.5 | 488.7 | 490.3 | 451.8 | 469.3 | 457.7 | 465.9 |
| 1998 | 403.0 | 428.8 | 431.6 | 442.7 | 465.2 | 466.8 | 504.5 | 481.4 | 461.2 | 463.5 | 446.3 | 454.8 |
| 1999 | 398.7 | 406.2 | 410.8 | 395.1 | 401.2 | 426.6 | 443.3 | 423.7 | 407.5 | 404.1 | 394.1 | 413.0 |
| 2000 | 343.9 | 355.0 | 329.5 | 323.0 | 359.4 | 348.8 | 354.1 | 344.8 | 331.7 | 342.3 | 352.1 | 365.2 |
| 2001 | 340.7 | 340.6 | 334.3 | 334.8 | 351.6 | 357.3 | 342.6 | 352.4 | 316.0 | 327.9 | 302.6 | 286.7 |
| 2002 | 272.8 | 290.4 | 299.9 | 300.8 | 314.3 | 321.8 | 332.7 | 322.5 | 307.7 | 309.7 | 302.8 | 303.1 |
| 2003 | 272.7 | 262.0 | 259.3 | 255.8 | 281.2 | 290.9 | 297.0 | 296.8 | 257.4 | 263.0 | 249.9 | 260.9 |
| 2004 | 235.8 | 226.4 | 219.1 | 219.9 | 218.6 | 206.8 | 211.0 | 213.4 | 213.8 | 206.6 | 201.9 | 211.6 |
| 2005 | 189.2 | 198.0 | 193.5 | 181.8 | 183.4 | 203.8 | 199.4 | 187.7 | 170.1 | 164.5 | 164.0 | 171.7 |
| 2006 | 149.4 | 154.3 | 151.5 | 153.6 | 152.3 | 152.0 | 153.7 | 150.7 | 141.0 | 143.8 | 135.5 | 132.0 |
| 2007 | 124.1 | 127.3 | 123.5 | 122.0 | 128.2 | 127.7 | 130.2 | 133.1 | 122.7 | 121.0 | 108.9 | 110.8 |
| 2008 | 101.2 | 98.4 | 102.5 | 100.2 | 99.3 | 95.4 | 95.9 | 92.7 | 86.5 | 88.0 | 87.5 | 88.2 |
| 2009 | 81.9 | 82.4 | 81.5 | 82.2 | 94.4 | 98.2 | 109.5 | 97.2 | 90.9 | 86.3 | 81.4 | 83.8 |
| 2010 | 71.9 | 73.6 | 75.1 | 78.3 | 86.3 | 87.3 | 99.9 | 91.9 | 84.7 | 79.2 | 72.4 | 74.0 |
| 2011 | 65.4 | 68.3 | 67.6 | 66.4 | 68.7 | 74.0 | 84.0 | 77.1 | 71.5 | 71.9 | 72.1 | 69.6 |
| 2012 | 60.2 | 64.3 | 62.3 | 61.4 | 67.1 | 69.3 | 72.4 | 71.0 | 59.2 | 59.7 | 67.4 | 56.5 |
| 2013 | 55.6 | 54.7 | 55.3 | 55.5 | 62.5 | 64.9 | 67.3 | 73.9 | 67.8 | 57.4 | 54.0 | 52.1 |
| 2014 | 38.5 | 38.1 | 39.6 | 39.8 | 47.4 | 51.2 | 48.5 | 46.9 | 42.7 | 40.3 | 37.9 | 37.3 |
| 2015 | 64.0 | 66.6 | 70.3 | 72.9 | 86.4 | 89.1 | 93.7 | 95.3 | 89.0 | 86.5 | 81.1 | 80.0 |
| 2016 | 73.7 | 74.5 | 79.2 | 81.5 | 87.2 | 93.9 | 97.3 | 97.2 | 91.2 | 87.6 | 85.2 | 84.9 |
| 2017 | 77.9 | 77.8 | 79.0 | 84.2 | 87.8 | 96.3 | 101.1 | 102.5 | 91.7 | 86.0 | 85.3 | 82.8 |
| 2018 | 76.8 | 77.3 | 80.0 | 81.8 | 87.2 | 91.0 | 93.3 | 93.5 | 87.1 | 80.1 | 75.9 | NA |
| 2019 | 34.3 | 34.1 | 34.7 | 37.6 | 42.0 | 43.1 | 49.4 | 46.9 | 39.7 | 35.8 | 36.2 | 32.9 |
| 2020 | 32.1 | 32.1 | 26.4 | 19.3 | 26.2 | 38.9 | 47.7 | 46.5 | 39.3 | 33.5 | 29.7 | 26.5 |
| 2021 | 25.5 | 25.0 | 27.6 | 27.7 | 33.1 | 40.9 | 43.3 | 43.9 | 38.3 | 37.3 | 31.8 | 29.9 |
| 2022 | 26.3 | 28.0 | 24.7 | |||||||||
| - = No Data Reported; -- = Not Applicable; NA = Not Available; W = Withheld to avoid disclosure of individual company data. |
| Release Date: 5/19/2022 |
| Next Release Date: TBD |