|
Download Data (XLS File) |
|
||||||||
|
||||||||
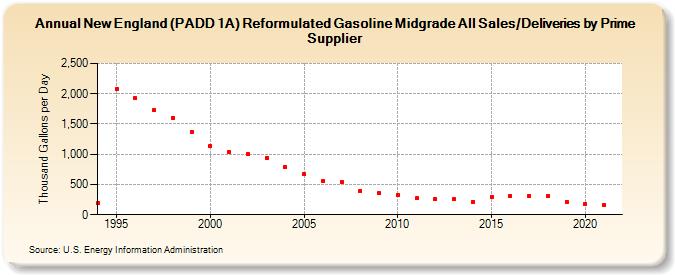
| New England (PADD 1A) Reformulated Gasoline Midgrade All Sales/Deliveries by Prime Supplier (Thousand Gallons per Day) | ||||||||
| Decade | Year-0 | Year-1 | Year-2 | Year-3 | Year-4 | Year-5 | Year-6 | Year-7 | Year-8 | Year-9 |
|---|---|---|---|---|---|---|---|---|---|---|
| 1990's | 185.4 | 2,082.8 | 1,927.4 | 1,726.9 | 1,605.4 | 1,372.4 | ||||
| 2000's | 1,139.6 | 1,043.6 | 1,001.5 | 942.9 | 784.9 | 670.6 | 556.3 | 545.0 | 388.7 | 358.6 |
| 2010's | 329.0 | 270.6 | 256.0 | 252.0 | 218.2 | 293.1 | 312.9 | 317.1 | 309.6 | 216.8 |
| 2020's | 178.4 |
| - = No Data Reported; -- = Not Applicable; NA = Not Available; W = Withheld to avoid disclosure of individual company data. |
| Release Date: 6/1/2022 |
| Next Release Date: TBD |