|
Download Data (XLS File) |
|
||||||||
|
||||||||
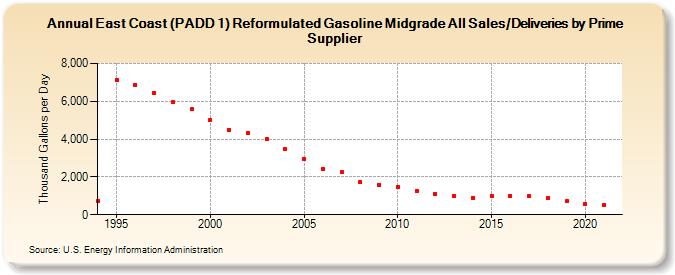
| East Coast (PADD 1) Reformulated Gasoline Midgrade All Sales/Deliveries by Prime Supplier (Thousand Gallons per Day) | ||||||||
| Decade | Year-0 | Year-1 | Year-2 | Year-3 | Year-4 | Year-5 | Year-6 | Year-7 | Year-8 | Year-9 |
|---|---|---|---|---|---|---|---|---|---|---|
| 1990's | 736.6 | 7,127.5 | 6,870.1 | 6,458.4 | 5,956.0 | 5,592.6 | ||||
| 2000's | 4,992.0 | 4,501.8 | 4,323.0 | 4,023.2 | 3,456.8 | 2,955.1 | 2,438.0 | 2,239.6 | 1,726.6 | 1,593.7 |
| 2010's | 1,481.4 | 1,277.9 | 1,089.5 | 1,006.4 | 898.7 | 1,013.9 | 1,012.7 | 976.6 | 874.5 | 699.4 |
| 2020's | 570.7 |
| - = No Data Reported; -- = Not Applicable; NA = Not Available; W = Withheld to avoid disclosure of individual company data. |
| Release Date: 6/1/2022 |
| Next Release Date: TBD |