|
Download Data (XLS File) |
|
||||||||
|
||||||||
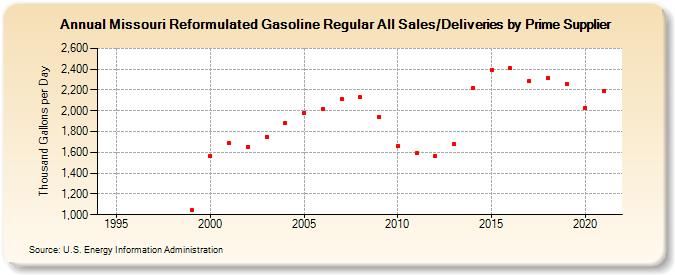
| Missouri Reformulated Gasoline Regular All Sales/Deliveries by Prime Supplier (Thousand Gallons per Day) | ||||||||
| Decade | Year-0 | Year-1 | Year-2 | Year-3 | Year-4 | Year-5 | Year-6 | Year-7 | Year-8 | Year-9 |
|---|---|---|---|---|---|---|---|---|---|---|
| 1990's | - | - | - | - | - | 1,043.2 | ||||
| 2000's | 1,564.9 | 1,685.7 | 1,652.3 | 1,751.9 | 1,883.8 | 1,978.7 | 2,012.6 | 2,115.5 | 2,127.9 | 1,943.3 |
| 2010's | 1,661.1 | 1,589.5 | 1,564.6 | 1,678.1 | 2,215.1 | 2,393.6 | 2,407.8 | 2,285.1 | 2,318.8 | 2,258.6 |
| 2020's | 2,027.8 |
| - = No Data Reported; -- = Not Applicable; NA = Not Available; W = Withheld to avoid disclosure of individual company data. |
| Release Date: 6/1/2022 |
| Next Release Date: TBD |