|
Download Data (XLS File) |
|
||||||||
|
||||||||
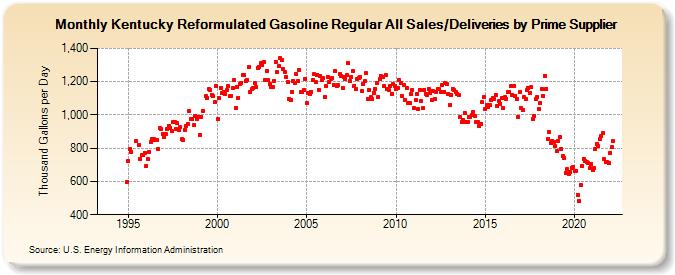
| Kentucky Reformulated Gasoline Regular All Sales/Deliveries by Prime Supplier (Thousand Gallons per Day) | ||||||||
| Year | Jan | Feb | Mar | Apr | May | Jun | Jul | Aug | Sep | Oct | Nov | Dec |
|---|---|---|---|---|---|---|---|---|---|---|---|---|
| 1993 | - | - | - | |||||||||
| 1994 | - | - | - | - | - | - | - | - | - | - | W | 596.3 |
| 1995 | 723.2 | 792.9 | 779.7 | W | W | 845.6 | W | 818.5 | 737.2 | 756.2 | 757.5 | 773.5 |
| 1996 | 691.6 | 736.0 | 779.8 | 838.7 | 853.2 | 855.7 | 847.5 | 849.9 | 795.8 | 919.8 | 915.3 | 886.8 |
| 1997 | 868.3 | 882.3 | 913.9 | 932.4 | 919.9 | 903.4 | 957.8 | 954.7 | 913.1 | 949.4 | 906.6 | 926.4 |
| 1998 | 853.9 | 848.2 | 911.4 | 936.3 | 942.6 | 1,022.0 | 977.8 | 974.1 | 936.9 | 995.7 | 975.7 | 988.6 |
| 1999 | 881.8 | 988.8 | 1,024.1 | W | 1,110.9 | 1,103.7 | 1,154.3 | 1,147.2 | 1,120.2 | 1,114.3 | 1,076.1 | 1,171.8 |
| 2000 | 974.5 | 1,098.8 | 1,161.3 | 1,132.5 | 1,137.6 | 1,124.8 | 1,147.9 | 1,173.5 | 1,111.5 | 1,114.0 | 1,159.7 | 1,210.1 |
| 2001 | 1,043.8 | 1,169.9 | 1,103.7 | 1,187.2 | 1,193.1 | 1,239.8 | 1,240.5 | 1,206.4 | 1,209.1 | 1,291.0 | 1,140.0 | 1,154.4 |
| 2002 | 1,163.0 | 1,189.7 | 1,167.5 | 1,283.7 | 1,290.9 | 1,309.9 | 1,302.2 | 1,320.1 | 1,211.2 | 1,263.3 | 1,210.3 | 1,185.8 |
| 2003 | 1,167.3 | 1,168.7 | 1,206.3 | 1,319.7 | 1,258.6 | 1,292.0 | 1,339.9 | 1,330.1 | 1,275.1 | 1,260.1 | 1,226.6 | 1,197.5 |
| 2004 | 1,097.0 | 1,089.2 | 1,139.1 | 1,204.1 | 1,194.4 | 1,245.8 | 1,206.4 | 1,270.3 | 1,134.8 | 1,137.1 | 1,149.8 | 1,215.7 |
| 2005 | 1,069.8 | 1,130.7 | 1,126.6 | 1,140.5 | 1,212.4 | 1,244.2 | 1,199.3 | 1,242.5 | 1,149.2 | 1,233.9 | 1,208.4 | 1,220.2 |
| 2006 | 1,110.5 | 1,174.3 | 1,228.9 | 1,200.7 | 1,217.3 | 1,222.8 | 1,180.1 | 1,265.0 | 1,175.8 | 1,178.5 | 1,245.2 | 1,235.4 |
| 2007 | 1,162.6 | 1,229.4 | 1,216.8 | 1,237.2 | 1,312.5 | 1,203.8 | 1,229.2 | 1,263.5 | 1,176.5 | 1,155.6 | 1,218.4 | 1,222.8 |
| 2008 | 1,229.3 | 1,144.0 | 1,184.9 | 1,202.1 | 1,249.6 | 1,093.8 | 1,152.4 | 1,105.8 | 1,094.6 | 1,134.4 | 1,157.3 | 1,193.5 |
| 2009 | 1,107.6 | 1,214.4 | 1,233.0 | 1,230.9 | 1,173.8 | 1,241.6 | 1,157.6 | 1,148.8 | 1,172.5 | 1,128.7 | 1,184.1 | 1,172.3 |
| 2010 | 1,155.6 | 1,159.3 | 1,211.2 | 1,193.3 | 1,115.3 | 1,181.3 | 1,091.2 | 1,164.0 | 1,073.5 | 1,073.1 | 1,123.9 | 1,150.3 |
| 2011 | 1,043.0 | 1,091.1 | 1,125.4 | 1,034.5 | 1,151.5 | 1,084.5 | 1,039.2 | 1,152.6 | 1,128.1 | 1,118.7 | 1,152.9 | 1,130.5 |
| 2012 | 1,088.9 | 1,142.5 | 1,097.4 | 1,135.3 | 1,153.7 | 1,155.5 | 1,136.1 | 1,180.6 | 1,139.3 | 1,192.7 | 1,188.7 | 1,128.7 |
| 2013 | 1,060.4 | 1,119.4 | 1,156.7 | 1,148.9 | 1,140.7 | 1,127.1 | 1,121.6 | 985.1 | 958.4 | 972.2 | 1,014.4 | 959.1 |
| 2014 | 957.7 | 987.3 | 989.3 | 998.1 | 1,016.2 | 994.0 | 959.1 | 957.3 | 933.0 | 948.3 | 1,077.0 | 1,110.5 |
| 2015 | 1,033.7 | 1,060.3 | 1,049.3 | 1,057.8 | 1,086.7 | 1,099.5 | 1,097.5 | 1,122.1 | 1,052.8 | 1,082.0 | 1,068.2 | 1,102.0 |
| 2016 | 1,039.3 | 1,106.5 | 1,098.5 | 1,137.6 | 1,137.9 | 1,171.4 | 1,122.3 | 1,176.6 | 1,112.9 | 1,098.5 | 990.0 | 1,135.8 |
| 2017 | 1,041.8 | 1,031.7 | 1,106.2 | 1,098.0 | 1,150.9 | 1,159.2 | 1,133.9 | 1,167.3 | 978.0 | 995.8 | 1,097.5 | 1,106.8 |
| 2018 | 1,035.7 | 1,073.3 | 1,157.5 | 1,116.2 | 1,235.8 | 1,157.4 | 855.1 | 895.0 | 828.4 | 843.5 | 838.0 | 811.5 |
| 2019 | 780.6 | 845.3 | 867.6 | 795.3 | 751.6 | 741.1 | 652.6 | 672.6 | 647.6 | 658.2 | 683.0 | 686.0 |
| 2020 | 662.4 | 663.1 | 521.4 | 483.5 | 576.1 | 693.1 | 735.0 | 720.9 | 714.0 | 710.3 | 680.1 | 707.9 |
| 2021 | 666.9 | 682.1 | 797.2 | 827.7 | 813.8 | 852.9 | 872.4 | 888.5 | 733.3 | 715.6 | 716.8 | 709.1 |
| 2022 | 771.8 | 804.7 | 841.5 | |||||||||
| - = No Data Reported; -- = Not Applicable; NA = Not Available; W = Withheld to avoid disclosure of individual company data. |
| Release Date: 5/19/2022 |
| Next Release Date: TBD |