|
Download Data (XLS File) |
|
||||||||
|
||||||||
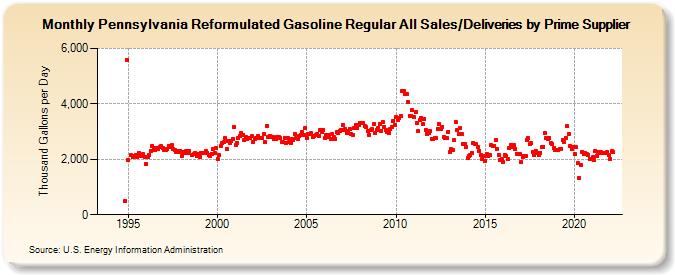
| Pennsylvania Reformulated Gasoline Regular All Sales/Deliveries by Prime Supplier (Thousand Gallons per Day) | ||||||||
| Year | Jan | Feb | Mar | Apr | May | Jun | Jul | Aug | Sep | Oct | Nov | Dec |
|---|---|---|---|---|---|---|---|---|---|---|---|---|
| 1993 | - | - | - | |||||||||
| 1994 | - | - | - | - | - | - | - | - | - | - | 493.7 | 5,593.9 |
| 1995 | 1,970.3 | W | 2,141.9 | 2,066.8 | 2,112.5 | 2,161.4 | 2,085.4 | 2,217.8 | 2,117.1 | 2,126.3 | 2,188.9 | 2,082.2 |
| 1996 | 1,846.0 | 2,094.5 | 2,170.5 | 2,290.2 | 2,482.4 | 2,414.2 | 2,324.4 | 2,388.8 | 2,377.7 | 2,437.7 | 2,466.4 | 2,407.7 |
| 1997 | 2,345.6 | 2,347.0 | 2,360.5 | 2,487.0 | 2,456.4 | 2,503.2 | 2,383.1 | 2,329.6 | 2,270.4 | 2,302.7 | 2,277.0 | 2,312.8 |
| 1998 | 2,125.6 | 2,250.0 | 2,240.5 | 2,310.5 | 2,212.8 | 2,291.9 | W | 2,148.7 | 2,176.9 | 2,237.2 | 2,115.9 | 2,179.9 |
| 1999 | 2,080.2 | 2,228.8 | 2,234.4 | W | 2,285.1 | 2,237.1 | 2,163.6 | 2,128.0 | 2,200.0 | 2,373.5 | 2,225.2 | 2,394.0 |
| 2000 | 2,005.9 | 2,136.4 | 2,487.7 | 2,569.2 | 2,618.2 | 2,764.4 | 2,385.5 | 2,668.0 | 2,592.7 | 2,662.7 | 2,726.8 | 3,166.1 |
| 2001 | 2,510.0 | 2,605.0 | 2,778.4 | 2,855.5 | 2,945.0 | 2,893.6 | 2,681.2 | 2,808.8 | 2,728.7 | 2,778.9 | 2,773.9 | 2,827.0 |
| 2002 | 2,630.3 | 2,727.1 | 2,782.0 | 2,837.1 | 2,782.0 | 2,785.0 | 2,765.2 | 2,899.4 | 2,632.1 | 3,214.7 | 2,809.0 | 2,849.6 |
| 2003 | 2,821.0 | 2,817.6 | 2,733.7 | 2,745.8 | 2,804.8 | 2,791.4 | 2,770.3 | 2,628.7 | 2,616.4 | 2,773.9 | 2,588.3 | 2,777.5 |
| 2004 | 2,611.1 | 2,572.8 | 2,719.2 | 2,701.3 | 2,912.4 | 2,759.3 | 2,732.5 | 2,839.9 | 2,882.0 | 2,975.0 | 2,890.3 | 3,116.4 |
| 2005 | 2,758.2 | 2,914.1 | 2,920.2 | 2,938.0 | 2,817.8 | 2,852.3 | 2,866.4 | 2,914.9 | 2,849.8 | 3,038.0 | 2,982.6 | 3,070.5 |
| 2006 | 2,756.9 | 2,866.5 | 2,805.9 | 2,878.0 | 2,748.1 | 2,904.4 | 2,807.3 | 2,720.0 | 2,978.8 | 2,934.7 | 3,018.5 | 3,072.6 |
| 2007 | 3,247.7 | 3,050.7 | 3,090.9 | 2,935.8 | 3,037.9 | 3,086.8 | 2,910.6 | 2,892.4 | 3,118.4 | 3,237.3 | 3,135.2 | 3,239.6 |
| 2008 | 3,301.9 | 3,298.8 | 3,310.3 | 3,194.8 | 3,163.3 | 3,003.4 | 2,880.1 | 3,052.4 | 3,075.0 | 3,280.3 | 2,947.7 | 3,067.4 |
| 2009 | 3,143.3 | 3,265.9 | 3,036.9 | 3,348.6 | 3,179.8 | 3,056.3 | 2,966.6 | 2,954.9 | 3,091.4 | 3,165.1 | 3,397.9 | 3,244.3 |
| 2010 | 3,520.9 | 3,399.9 | 3,486.0 | 3,575.7 | 4,462.8 | 4,451.1 | 4,372.4 | 4,361.1 | 4,050.7 | 3,577.7 | 3,570.1 | 3,763.7 |
| 2011 | 3,508.8 | 3,704.8 | 3,316.1 | 3,004.2 | 3,432.9 | 3,475.3 | 3,279.0 | 3,460.8 | 3,072.9 | 2,922.9 | 2,939.8 | 3,005.9 |
| 2012 | 2,736.5 | 2,721.9 | 2,777.9 | 2,749.6 | 3,097.1 | 3,274.3 | 3,082.2 | 3,167.3 | 2,802.9 | 2,751.7 | 2,753.5 | 2,996.6 |
| 2013 | 2,247.3 | 2,362.2 | 2,350.5 | 2,700.9 | 3,350.4 | 3,061.4 | 2,895.7 | 3,111.2 | 2,902.9 | 2,563.0 | 2,561.2 | 2,425.8 |
| 2014 | 2,041.3 | 2,120.0 | 2,142.3 | 2,215.7 | 2,601.9 | 2,540.6 | 2,533.6 | 2,439.1 | 2,302.7 | 2,139.3 | 2,006.2 | 2,117.7 |
| 2015 | 1,949.1 | 2,189.0 | 2,115.3 | 2,137.8 | 2,505.5 | 2,485.4 | 2,492.8 | 2,696.2 | 2,355.1 | 2,156.9 | 1,990.6 | 2,011.6 |
| 2016 | 1,892.7 | 2,139.8 | 2,120.5 | 2,014.1 | 2,419.2 | 2,517.1 | 2,435.9 | 2,498.9 | 2,375.4 | 2,204.2 | 2,175.2 | 2,172.8 |
| 2017 | 1,887.4 | 2,088.6 | 2,107.3 | 2,135.8 | 2,699.5 | 2,751.2 | 2,537.5 | 2,592.3 | 2,275.6 | 2,148.4 | 2,298.8 | 2,231.7 |
| 2018 | 2,165.1 | 2,243.4 | 2,440.4 | 2,452.2 | 2,938.1 | 2,784.5 | 2,730.0 | 2,770.6 | 2,579.1 | 2,545.1 | 2,417.0 | 2,324.2 |
| 2019 | 2,335.4 | 2,334.8 | 2,383.3 | 2,380.4 | 2,689.0 | 2,628.3 | 2,774.4 | 3,191.6 | 2,923.5 | 2,490.0 | 2,374.4 | 2,453.5 |
| 2020 | 2,182.2 | 2,442.5 | 1,849.8 | 1,323.8 | 1,794.1 | 2,267.8 | 2,207.0 | 2,230.9 | 2,199.2 | 2,161.7 | 2,022.5 | 1,999.6 |
| 2021 | 2,068.1 | 1,991.5 | 2,309.3 | 2,131.6 | 2,274.3 | 2,219.3 | 2,251.1 | 2,230.3 | 2,228.2 | 2,239.8 | 2,258.9 | 2,151.8 |
| 2022 | 2,017.2 | 2,281.8 | 2,273.4 | |||||||||
| - = No Data Reported; -- = Not Applicable; NA = Not Available; W = Withheld to avoid disclosure of individual company data. |
| Release Date: 5/19/2022 |
| Next Release Date: TBD |