|
Download Data (XLS File) |
|
||||||||
|
||||||||
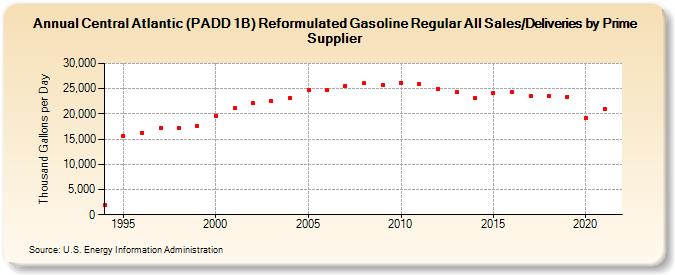
| Central Atlantic (PADD 1B) Reformulated Gasoline Regular All Sales/Deliveries by Prime Supplier (Thousand Gallons per Day) | ||||||||
| Decade | Year-0 | Year-1 | Year-2 | Year-3 | Year-4 | Year-5 | Year-6 | Year-7 | Year-8 | Year-9 |
|---|---|---|---|---|---|---|---|---|---|---|
| 1990's | 1,840.4 | 15,661.6 | 16,306.2 | 17,221.9 | 17,236.8 | 17,529.0 | ||||
| 2000's | 19,585.1 | 21,198.8 | 22,068.3 | 22,551.2 | 23,201.8 | 24,822.0 | 24,795.9 | 25,490.8 | 26,043.5 | 25,765.1 |
| 2010's | 26,190.0 | 25,996.0 | 25,025.4 | 24,420.4 | 23,080.2 | 24,061.9 | 24,277.3 | 23,610.0 | 23,582.4 | 23,434.3 |
| 2020's | 19,147.8 |
| - = No Data Reported; -- = Not Applicable; NA = Not Available; W = Withheld to avoid disclosure of individual company data. |
| Release Date: 6/1/2022 |
| Next Release Date: TBD |