|
Download Data (XLS File) |
|
||||||||
|
||||||||
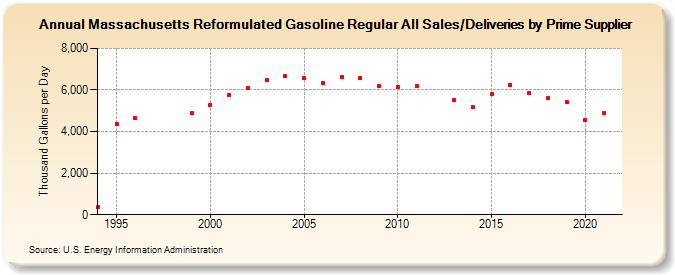
| Massachusetts Reformulated Gasoline Regular All Sales/Deliveries by Prime Supplier (Thousand Gallons per Day) | ||||||||
| Decade | Year-0 | Year-1 | Year-2 | Year-3 | Year-4 | Year-5 | Year-6 | Year-7 | Year-8 | Year-9 |
|---|---|---|---|---|---|---|---|---|---|---|
| 1990's | 363.8 | 4,377.5 | 4,660.2 | W | W | 4,878.3 | ||||
| 2000's | 5,291.9 | 5,736.2 | 6,091.8 | 6,460.2 | 6,668.6 | 6,578.0 | 6,330.3 | 6,610.9 | 6,580.5 | 6,172.4 |
| 2010's | 6,132.4 | 6,209.2 | W | 5,513.3 | 5,199.8 | 5,795.4 | 6,252.5 | 5,850.5 | 5,595.4 | 5,416.5 |
| 2020's | 4,571.5 |
| - = No Data Reported; -- = Not Applicable; NA = Not Available; W = Withheld to avoid disclosure of individual company data. |
| Release Date: 6/1/2022 |
| Next Release Date: TBD |