|
Download Data (XLS File) |
|
||||||||
|
||||||||
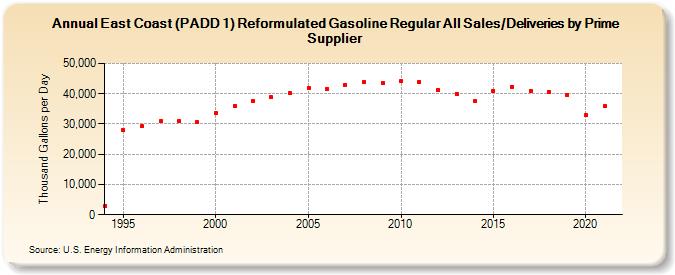
| East Coast (PADD 1) Reformulated Gasoline Regular All Sales/Deliveries by Prime Supplier (Thousand Gallons per Day) | ||||||||
| Decade | Year-0 | Year-1 | Year-2 | Year-3 | Year-4 | Year-5 | Year-6 | Year-7 | Year-8 | Year-9 |
|---|---|---|---|---|---|---|---|---|---|---|
| 1990's | 2,854.9 | 27,971.1 | 29,279.0 | 30,929.2 | 30,864.1 | 30,566.8 | ||||
| 2000's | 33,510.9 | 35,944.6 | 37,519.1 | 38,813.2 | 40,111.7 | 41,997.9 | 41,694.8 | 42,957.1 | 43,822.0 | 43,647.5 |
| 2010's | 44,133.4 | 44,013.8 | 41,369.7 | 40,060.6 | 37,510.1 | 41,053.6 | 42,367.7 | 40,938.5 | 40,730.5 | 39,682.7 |
| 2020's | 32,921.7 |
| - = No Data Reported; -- = Not Applicable; NA = Not Available; W = Withheld to avoid disclosure of individual company data. |
| Release Date: 6/1/2022 |
| Next Release Date: TBD |