|
Download Data (XLS File) |
|
||||||||
|
||||||||
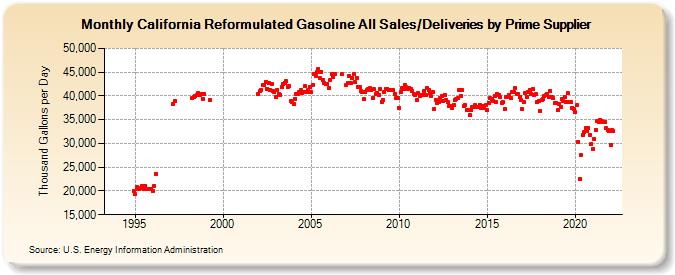
| California Reformulated Gasoline All Sales/Deliveries by Prime Supplier (Thousand Gallons per Day) | ||||||||
| Year | Jan | Feb | Mar | Apr | May | Jun | Jul | Aug | Sep | Oct | Nov | Dec |
|---|---|---|---|---|---|---|---|---|---|---|---|---|
| 1993 | - | - | - | |||||||||
| 1994 | - | - | - | - | - | - | - | - | - | - | W | 19,885.7 |
| 1995 | 19,259.3 | 20,744.9 | 20,373.6 | 20,494.8 | 20,596.5 | 21,133.4 | 20,398.2 | 21,114.8 | W | 20,498.5 | 20,343.8 | 20,471.3 |
| 1996 | 19,970.0 | 21,097.3 | 23,625.5 | W | W | W | W | W | W | W | W | W |
| 1997 | W | W | 38,299.0 | 38,967.9 | W | W | W | W | W | W | W | W |
| 1998 | W | W | W | 39,537.6 | 39,738.1 | 40,053.6 | 40,239.9 | 40,564.6 | 40,121.3 | 40,499.4 | 39,345.7 | 40,420.9 |
| 1999 | W | W | W | 39,142.7 | W | W | W | W | W | W | W | W |
| 2000 | W | W | W | W | W | W | W | W | W | W | W | W |
| 2001 | W | W | W | W | W | W | W | W | W | W | W | W |
| 2002 | 40,442.2 | 40,957.0 | 41,261.2 | 42,195.5 | 42,224.4 | 43,024.1 | 41,543.6 | 42,643.9 | 41,264.2 | 42,507.7 | 40,952.1 | 40,722.4 |
| 2003 | 39,836.2 | 41,244.5 | 40,419.5 | 40,199.3 | 41,777.4 | 42,419.5 | 42,776.3 | 43,112.7 | 41,967.7 | 42,065.0 | 38,911.9 | 38,819.0 |
| 2004 | 38,208.6 | 39,415.7 | 40,476.0 | 40,481.0 | 40,746.6 | 41,184.3 | 40,665.1 | 40,778.0 | 42,026.0 | 40,758.0 | 41,173.5 | 41,825.1 |
| 2005 | 40,756.3 | 42,366.8 | 44,581.6 | 44,283.0 | 44,960.5 | 45,697.4 | 43,686.2 | 45,126.6 | 43,419.1 | 42,720.3 | 42,504.5 | 42,559.8 |
| 2006 | 41,733.7 | 43,449.6 | 44,536.6 | 44,062.3 | 44,688.3 | W | W | W | W | 44,553.1 | W | W |
| 2007 | 42,216.1 | 42,758.5 | 44,283.6 | 42,688.1 | 43,765.7 | 44,524.8 | 42,852.0 | 43,874.3 | 41,944.0 | 41,932.4 | 40,973.0 | 40,759.7 |
| 2008 | 39,344.4 | 40,748.0 | 41,157.4 | 41,392.0 | 41,639.7 | 41,215.9 | 39,633.3 | 41,373.8 | 40,313.0 | 40,635.3 | 40,279.6 | 41,477.8 |
| 2009 | 38,815.0 | 39,097.4 | 40,857.5 | 41,492.0 | 41,546.9 | 41,342.8 | 41,189.7 | 41,147.8 | 41,154.0 | 40,370.7 | 39,489.1 | 39,657.0 |
| 2010 | 37,370.1 | 40,729.8 | 41,654.0 | 41,480.1 | 42,272.1 | 41,776.2 | 41,423.5 | 41,736.9 | 41,482.2 | 41,035.6 | 40,431.0 | 40,274.3 |
| 2011 | 39,119.0 | 40,696.2 | 40,023.5 | 40,118.4 | 40,295.6 | 40,943.5 | 40,293.9 | 41,603.5 | 41,298.0 | 40,704.8 | 39,918.4 | 40,728.7 |
| 2012 | 37,200.6 | 39,228.4 | 38,529.0 | 38,614.6 | 39,523.8 | 39,991.0 | 39,004.6 | 40,295.0 | 39,236.0 | 38,636.8 | 37,808.5 | 37,817.4 |
| 2013 | 37,511.4 | 38,141.5 | 39,226.6 | 39,316.8 | 39,465.7 | 41,213.8 | 40,038.5 | 41,223.2 | 37,861.3 | 38,048.3 | 36,954.9 | 37,094.6 |
| 2014 | 35,879.3 | 37,082.1 | 37,620.2 | 37,661.5 | 38,053.9 | 37,590.1 | 37,662.3 | 38,062.2 | 37,528.4 | 37,844.9 | 37,495.5 | 38,066.5 |
| 2015 | 37,031.6 | 38,608.6 | 39,497.0 | 39,349.0 | 39,000.9 | 39,997.0 | 38,757.0 | 40,441.0 | 40,105.6 | 39,754.9 | 38,491.7 | 38,654.7 |
| 2016 | 37,154.1 | 39,840.1 | 39,792.9 | 40,174.9 | 39,602.7 | 40,904.7 | 40,827.3 | 41,659.6 | 40,421.5 | 40,369.6 | 39,668.5 | 39,208.4 |
| 2017 | 37,225.2 | 38,679.6 | 40,572.9 | 39,791.1 | 40,732.6 | 41,230.9 | 40,352.4 | 41,419.8 | 40,212.6 | 40,333.6 | 38,633.1 | 38,968.7 |
| 2018 | 36,873.2 | 39,211.8 | 39,429.8 | 39,905.6 | 40,136.2 | 40,475.2 | 39,835.3 | 41,070.5 | 39,825.4 | 39,537.3 | 38,553.6 | 38,591.6 |
| 2019 | 37,062.5 | 38,322.0 | 37,675.3 | 39,331.5 | 38,889.0 | 39,695.5 | 38,714.9 | 40,538.4 | 38,777.7 | 38,720.5 | 37,525.2 | 37,170.0 |
| 2020 | 36,639.5 | 38,001.6 | 30,314.2 | 22,534.5 | 27,489.3 | 31,800.5 | 32,326.3 | 33,243.4 | 32,601.6 | 33,204.8 | 31,771.7 | 29,958.5 |
| 2021 | 28,750.5 | 31,034.4 | 32,894.9 | 34,768.7 | 34,586.1 | 35,021.2 | 34,811.9 | 34,593.5 | 34,431.9 | 33,266.4 | 32,910.4 | 32,520.6 |
| 2022 | 29,603.6 | 32,841.6 | 32,593.8 | |||||||||
| - = No Data Reported; -- = Not Applicable; NA = Not Available; W = Withheld to avoid disclosure of individual company data. |
| Release Date: 5/19/2022 |
| Next Release Date: TBD |