|
Download Data (XLS File) |
|
||||||||
|
||||||||
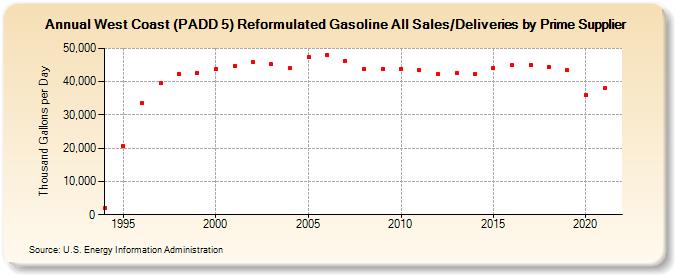
| West Coast (PADD 5) Reformulated Gasoline All Sales/Deliveries by Prime Supplier (Thousand Gallons per Day) | ||||||||
| Decade | Year-0 | Year-1 | Year-2 | Year-3 | Year-4 | Year-5 | Year-6 | Year-7 | Year-8 | Year-9 |
|---|---|---|---|---|---|---|---|---|---|---|
| 1990's | 1,953.4 | 20,520.4 | 33,556.1 | 39,523.7 | 42,418.7 | 42,582.1 | ||||
| 2000's | 43,731.6 | 44,652.8 | 45,762.5 | 45,216.4 | 44,008.1 | 47,339.8 | 48,072.9 | 46,261.3 | 43,859.6 | 43,846.4 |
| 2010's | 43,941.8 | 43,424.1 | 42,320.3 | 42,565.3 | 42,247.8 | 44,042.8 | 45,131.2 | 45,075.1 | 44,411.0 | 43,491.6 |
| 2020's | 35,967.5 |
| - = No Data Reported; -- = Not Applicable; NA = Not Available; W = Withheld to avoid disclosure of individual company data. |
| Release Date: 6/1/2022 |
| Next Release Date: TBD |