|
Download Data (XLS File) |
|
||||||||
|
||||||||
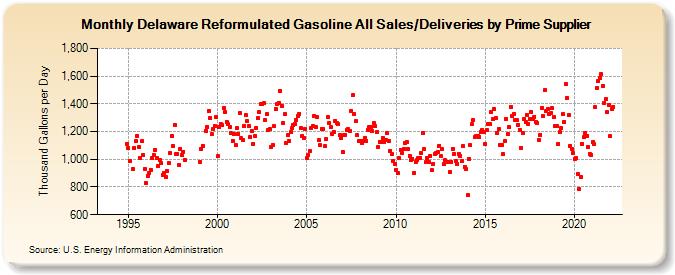
| Delaware Reformulated Gasoline All Sales/Deliveries by Prime Supplier (Thousand Gallons per Day) | ||||||||
| Year | Jan | Feb | Mar | Apr | May | Jun | Jul | Aug | Sep | Oct | Nov | Dec |
|---|---|---|---|---|---|---|---|---|---|---|---|---|
| 1993 | - | - | - | |||||||||
| 1994 | - | - | - | - | - | - | - | - | - | - | W | 1,111.2 |
| 1995 | 1,082.2 | 988.4 | W | 930.7 | 1,081.3 | 1,132.9 | 1,169.7 | 1,090.2 | 1,007.7 | 1,128.7 | 1,032.2 | 932.3 |
| 1996 | 826.9 | 881.3 | 899.8 | 924.6 | 1,007.0 | 1,031.6 | 1,066.5 | 1,011.7 | 951.5 | 998.1 | 971.9 | 885.8 |
| 1997 | 897.6 | 871.4 | 912.7 | 972.8 | 1,046.9 | 1,167.9 | 1,098.9 | 1,246.1 | 1,034.9 | 1,038.5 | 961.3 | 1,076.5 |
| 1998 | 1,032.2 | 1,054.4 | 993.7 | W | W | W | W | W | W | W | W | W |
| 1999 | 982.6 | 1,076.9 | 1,098.6 | W | 1,204.9 | 1,234.7 | 1,349.7 | 1,298.8 | 1,180.3 | 1,218.5 | 1,241.0 | 1,303.8 |
| 2000 | 1,020.4 | 1,234.2 | 1,255.1 | 1,246.8 | 1,372.1 | 1,341.7 | 1,271.4 | 1,252.5 | 1,232.8 | 1,186.0 | 1,135.1 | 1,183.3 |
| 2001 | 1,103.9 | 1,226.7 | 1,182.4 | 1,335.8 | 1,150.3 | 1,138.5 | 1,240.3 | 1,318.3 | 1,275.3 | 1,242.9 | 1,162.9 | 1,204.5 |
| 2002 | 1,113.6 | 1,166.4 | 1,227.6 | 1,297.3 | 1,337.6 | 1,398.6 | 1,395.7 | 1,403.8 | 1,282.6 | 1,326.4 | 1,213.3 | 1,219.1 |
| 2003 | 1,091.7 | 1,104.9 | 1,238.2 | 1,365.6 | 1,396.3 | 1,406.9 | 1,491.5 | 1,387.5 | 1,264.5 | 1,324.1 | 1,117.0 | 1,173.0 |
| 2004 | 1,133.5 | 1,196.4 | 1,224.4 | 1,248.3 | 1,257.1 | 1,285.2 | 1,309.7 | 1,328.8 | 1,222.2 | 1,166.7 | 1,155.4 | 1,216.0 |
| 2005 | 1,006.3 | 1,032.4 | 1,056.2 | 1,228.8 | 1,243.2 | 1,310.4 | 1,234.6 | 1,302.7 | 1,135.6 | 1,102.3 | 1,220.6 | 1,215.5 |
| 2006 | 1,094.6 | 1,146.1 | 1,302.8 | 1,264.6 | 1,229.3 | 1,183.6 | 1,200.1 | 1,278.7 | 1,259.1 | 1,251.2 | 1,171.7 | 1,150.6 |
| 2007 | 1,053.6 | 1,172.8 | 1,177.0 | 1,212.9 | 1,215.6 | 1,206.3 | 1,350.9 | 1,461.0 | 1,325.8 | 1,273.5 | 1,172.2 | 1,128.7 |
| 2008 | 1,131.5 | 1,116.2 | 1,130.3 | 1,154.7 | 1,132.4 | 1,213.0 | 1,234.3 | 1,233.6 | 1,206.1 | 1,261.2 | 1,238.8 | 1,197.5 |
| 2009 | 1,089.3 | 1,126.2 | 1,126.5 | 1,156.7 | 1,124.5 | 1,137.3 | 1,189.5 | 1,132.8 | 1,061.4 | 1,038.8 | 988.7 | 968.2 |
| 2010 | 925.7 | 897.7 | 1,006.2 | 1,070.2 | 1,047.8 | 1,071.5 | 1,116.1 | 1,124.2 | 1,074.8 | 1,023.8 | 997.5 | 1,003.8 |
| 2011 | 902.4 | 980.5 | 995.9 | 1,011.4 | 1,012.3 | 1,041.7 | 1,192.1 | 1,071.5 | 978.6 | 1,005.7 | 978.1 | 1,026.6 |
| 2012 | 921.2 | 966.4 | 1,036.9 | 1,047.5 | 1,051.6 | 1,097.7 | 1,021.3 | 1,071.8 | 966.5 | 991.5 | W | 980.1 |
| 2013 | 906.6 | 982.8 | 1,076.4 | 1,038.8 | 987.1 | 969.5 | 1,038.8 | 1,026.6 | 987.4 | 1,093.1 | 947.0 | 926.3 |
| 2014 | 741.5 | 1,002.8 | 1,100.9 | 1,251.1 | 1,279.8 | 1,160.9 | 1,165.5 | 1,170.7 | 1,161.3 | 1,197.3 | 1,209.1 | 1,194.5 |
| 2015 | 1,108.5 | 1,209.1 | 1,255.4 | 1,251.9 | 1,338.3 | 1,287.2 | 1,360.9 | 1,296.7 | 1,188.1 | 1,219.5 | 1,104.6 | 1,106.2 |
| 2016 | 1,037.7 | 1,129.0 | 1,292.5 | 1,181.4 | 1,234.1 | 1,380.0 | 1,312.5 | 1,326.9 | 1,282.8 | 1,283.1 | 1,249.2 | 1,213.2 |
| 2017 | 1,084.6 | 1,192.1 | 1,288.8 | 1,272.3 | 1,322.9 | 1,257.1 | 1,290.8 | 1,342.7 | 1,293.2 | 1,307.7 | 1,270.8 | 1,259.2 |
| 2018 | 1,140.7 | 1,177.0 | 1,372.0 | 1,309.1 | 1,498.5 | 1,346.6 | 1,363.1 | 1,323.8 | 1,334.7 | 1,368.0 | 1,302.6 | 1,238.8 |
| 2019 | 1,238.4 | 1,112.0 | 1,196.4 | 1,225.2 | 1,325.9 | 1,270.8 | 1,539.5 | 1,443.8 | 1,317.9 | 1,098.9 | 1,076.9 | 1,044.0 |
| 2020 | 1,003.6 | 1,009.9 | 896.2 | 786.5 | 875.4 | 1,112.3 | 1,157.6 | 1,189.0 | 1,170.4 | 1,090.9 | 1,041.0 | 1,031.5 |
| 2021 | 1,121.9 | 1,108.7 | 1,375.4 | 1,514.9 | 1,564.4 | 1,584.6 | 1,614.8 | 1,528.5 | 1,405.7 | 1,432.8 | 1,337.9 | 1,394.5 |
| 2022 | 1,165.1 | 1,360.1 | 1,378.3 | |||||||||
| - = No Data Reported; -- = Not Applicable; NA = Not Available; W = Withheld to avoid disclosure of individual company data. |
| Release Date: 5/19/2022 |
| Next Release Date: TBD |