|
Download Data (XLS File) |
|
||||||||
|
||||||||
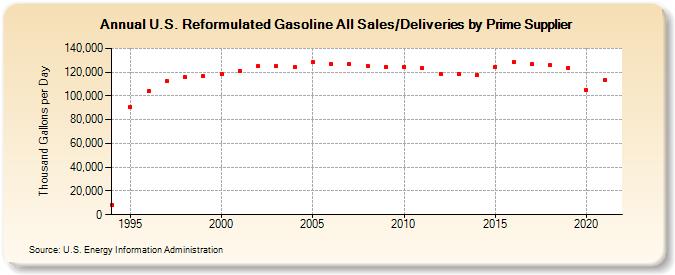
| U.S. Reformulated Gasoline All Sales/Deliveries by Prime Supplier (Thousand Gallons per Day) | ||||||||
| Decade | Year-0 | Year-1 | Year-2 | Year-3 | Year-4 | Year-5 | Year-6 | Year-7 | Year-8 | Year-9 |
|---|---|---|---|---|---|---|---|---|---|---|
| 1990's | 8,526.8 | 90,577.2 | 104,087.1 | 112,230.8 | 115,781.2 | 116,862.3 | ||||
| 2000's | 118,248.5 | 121,147.1 | 124,903.2 | 124,964.0 | 124,018.3 | 128,358.1 | 127,081.4 | 126,778.2 | 125,296.1 | 124,404.2 |
| 2010's | 124,699.4 | 123,321.2 | 118,687.9 | 118,856.6 | 117,629.2 | 124,734.1 | 128,633.4 | 126,452.7 | 125,709.4 | 123,537.7 |
| 2020's | 104,754.2 |
| - = No Data Reported; -- = Not Applicable; NA = Not Available; W = Withheld to avoid disclosure of individual company data. |
| Release Date: 6/1/2022 |
| Next Release Date: TBD |