|
Download Data (XLS File) |
|
||||||||
|
||||||||
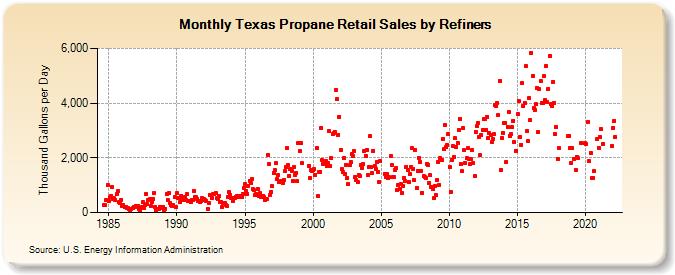
| Texas Propane Retail Sales by Refiners (Thousand Gallons per Day) | ||||||||
| Year | Jan | Feb | Mar | Apr | May | Jun | Jul | Aug | Sep | Oct | Nov | Dec |
|---|---|---|---|---|---|---|---|---|---|---|---|---|
| 1984 | 292.6 | 266.3 | 459.6 | 1,014.6 | ||||||||
| 1985 | 413.7 | 558.6 | 621.1 | 927.4 | 492.8 | 525.0 | 459.7 | 685.6 | 771.2 | 376.0 | 363.1 | 470.4 |
| 1986 | 250.1 | 286.9 | 188.1 | 221.2 | 166.3 | 179.1 | 133.0 | 101.0 | 123.7 | 151.9 | 200.1 | 206.1 |
| 1987 | 248.1 | 237.6 | 232.9 | 136.0 | 88.9 | 199.5 | 369.9 | 173.3 | 284.3 | 691.2 | 298.6 | 470.8 |
| 1988 | 481.5 | 225.3 | 370.4 | 489.3 | 720.9 | 193.8 | 97.5 | 132.4 | 138.8 | 217.3 | 161.9 | 167.8 |
| 1989 | 210.8 | 104.3 | 142.9 | 676.8 | 460.6 | 720.2 | 347.4 | 266.1 | 257.0 | 267.0 | 581.0 | 195.0 |
| 1990 | 712.0 | 527.0 | 534.1 | 387.6 | 621.7 | 459.0 | 534.9 | 569.9 | 471.6 | 662.9 | 414.1 | 434.5 |
| 1991 | 403.3 | 457.0 | 449.7 | 801.3 | 566.0 | 553.4 | 495.7 | 415.5 | 397.4 | 419.8 | 533.0 | 451.4 |
| 1992 | 488.9 | 464.5 | 433.8 | 122.0 | 355.4 | 659.0 | 625.3 | 530.6 | 668.7 | 690.8 | 728.8 | 519.3 |
| 1993 | 496.2 | 603.0 | 381.6 | 392.2 | 199.4 | 332.4 | 357.3 | 283.6 | 232.8 | 570.1 | 737.5 | 655.5 |
| 1994 | 546.1 | 432.8 | 527.9 | 527.9 | 582.9 | 592.4 | 562.0 | 598.2 | 600.3 | 566.1 | 688.6 | 905.8 |
| 1995 | 1,037.2 | 793.6 | 693.6 | 982.9 | 1,170.1 | 1,096.5 | 1,223.2 | 862.9 | 809.2 | 641.7 | 693.4 | 853.8 |
| 1996 | 598.8 | 700.6 | 586.4 | 590.5 | 617.5 | 556.4 | 461.5 | 491.6 | 2,121.1 | 1,756.9 | 657.2 | 761.6 |
| 1997 | 957.5 | 1,452.5 | 1,541.9 | 1,796.8 | 1,225.6 | 1,359.6 | 1,113.4 | 1,118.9 | 1,136.2 | 1,072.7 | 1,182.3 | 1,501.5 |
| 1998 | 1,679.9 | 2,354.0 | 1,726.9 | 1,347.4 | 1,596.7 | 1,533.1 | 1,155.3 | 1,647.2 | 1,375.2 | 1,442.5 | 1,143.6 | 2,529.4 |
| 1999 | 2,243.5 | 2,543.4 | 1,796.3 | W | W | W | W | W | 1,702.4 | 1,272.9 | 1,542.2 | 1,514.7 |
| 2000 | 1,550.2 | 1,591.6 | 1,385.4 | 2,377.5 | 608.7 | 1,482.1 | 1,500.5 | 3,102.9 | 1,913.4 | 1,782.8 | 1,772.6 | 1,885.8 |
| 2001 | 1,690.0 | 1,819.8 | 2,985.9 | 1,693.8 | 1,990.5 | 2,871.1 | 2,893.2 | 2,955.5 | 4,492.2 | 4,134.0 | 2,836.5 | 3,503.7 |
| 2002 | 2,284.7 | 1,590.2 | 1,477.5 | 1,994.2 | 1,415.2 | 1,754.0 | 1,275.2 | 1,048.7 | 1,720.3 | 1,848.0 | 2,157.6 | 2,068.7 |
| 2003 | 2,248.2 | 1,309.4 | 1,183.6 | 1,103.6 | 1,369.7 | 1,330.7 | 1,730.5 | 1,641.6 | 1,783.2 | 2,261.1 | 2,079.2 | 2,286.4 |
| 2004 | 1,358.2 | 1,663.2 | 2,785.6 | 1,655.4 | 1,431.1 | 2,255.9 | 1,708.9 | 1,575.4 | 1,861.7 | 1,489.3 | 1,118.4 | 1,871.7 |
| 2005 | W | W | W | 1,426.5 | 1,301.5 | 1,417.0 | 1,267.8 | 1,294.4 | 2,060.1 | 1,751.5 | 1,287.6 | 1,317.4 |
| 2006 | 1,572.4 | 1,634.2 | 825.0 | 1,008.1 | 845.4 | 1,034.5 | 727.4 | 969.9 | 1,275.3 | 1,142.0 | 1,680.4 | 1,572.2 |
| 2007 | 1,132.4 | 1,404.7 | 1,675.9 | 2,341.5 | 1,600.6 | 1,174.2 | 2,300.1 | 906.7 | 1,523.1 | 1,994.1 | 1,846.6 | 1,507.1 |
| 2008 | 730.5 | 1,335.3 | 1,317.9 | 1,257.5 | 1,791.8 | 1,754.1 | 1,095.5 | 1,357.2 | 952.3 | 856.4 | 518.5 | 970.7 |
| 2009 | 633.3 | 1,202.5 | 1,858.1 | 1,014.0 | 1,985.5 | 1,932.6 | 2,703.9 | 2,305.2 | 3,197.1 | 2,392.8 | 2,471.2 | 2,860.2 |
| 2010 | 1,673.3 | 764.4 | 1,907.7 | 2,415.8 | 2,035.5 | 2,714.0 | 2,402.9 | 2,544.9 | 3,016.1 | 3,428.8 | 1,776.2 | 1,508.4 |
| 2011 | 3,086.6 | 2,271.4 | 1,828.7 | 1,977.1 | 2,349.2 | 1,974.0 | 1,756.7 | 1,942.0 | 2,280.3 | 1,803.0 | 1,330.1 | 2,958.9 |
| 2012 | 3,152.1 | 3,285.9 | 2,766.0 | 2,088.7 | 2,834.3 | 3,021.8 | 3,418.1 | 3,421.1 | 3,032.0 | 3,506.0 | 2,709.0 | 2,916.3 |
| 2013 | 2,837.2 | 2,579.9 | 2,696.2 | 2,855.5 | 3,926.7 | 3,905.7 | 4,000.2 | 3,551.2 | 4,824.1 | 1,571.5 | 2,740.2 | 2,914.9 |
| 2014 | 3,258.2 | 3,274.1 | 1,864.0 | 3,141.2 | 3,676.4 | 2,812.0 | 2,861.0 | 3,124.2 | 3,359.0 | 2,570.4 | 2,265.7 | W |
| 2015 | 3,610.1 | 4,076.7 | 2,778.2 | 2,481.6 | 4,718.0 | 3,879.9 | 4,015.9 | 5,338.5 | 2,974.6 | 2,621.8 | 4,186.3 | 3,387.5 |
| 2016 | 5,837.0 | 5,007.6 | 3,806.1 | 3,761.6 | 3,955.2 | 4,561.5 | 2,935.9 | 4,509.5 | 4,814.6 | 4,005.7 | 4,009.1 | 4,980.7 |
| 2017 | 4,131.3 | 5,349.1 | 4,029.9 | 4,516.9 | 5,737.6 | 3,951.1 | 3,903.1 | 4,788.1 | 4,016.4 | 2,866.2 | 3,128.0 | 1,962.8 |
| 2018 | 2,343.1 | W | W | W | W | W | W | W | 2,780.0 | 2,816.3 | 2,368.3 | 1,822.1 |
| 2019 | 2,357.6 | 1,975.2 | W | 1,573.2 | 2,032.8 | 1,985.3 | W | W | 2,535.2 | W | W | 2,524.3 |
| 2020 | 2,521.6 | W | 3,307.8 | 1,879.3 | 2,177.0 | 1,260.5 | 1,268.7 | 1,515.2 | W | W | 2,698.1 | 2,377.7 |
| 2021 | 2,774.8 | 3,055.4 | W | 2,507.8 | W | W | W | W | W | W | W | 2,445.5 |
| 2022 | 3,105.3 | 3,357.0 | 2,766.6 | |||||||||
| - = No Data Reported; -- = Not Applicable; NA = Not Available; W = Withheld to avoid disclosure of individual company data. |
| Release Date: 6/1/2022 |
| Next Release Date: TBD |