|
Download Data (XLS File) |
|
||||||||
|
||||||||
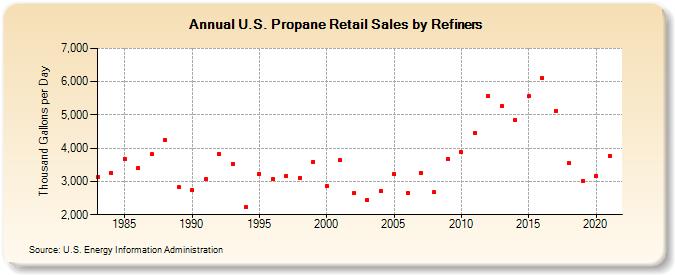
| U.S. Propane Retail Sales by Refiners (Thousand Gallons per Day) | ||||||||
| Decade | Year-0 | Year-1 | Year-2 | Year-3 | Year-4 | Year-5 | Year-6 | Year-7 | Year-8 | Year-9 |
|---|---|---|---|---|---|---|---|---|---|---|
| 1980's | 3,127.0 | 3,268.3 | 3,688.7 | 3,410.0 | 3,816.6 | 4,255.5 | 2,824.1 | |||
| 1990's | 2,730.7 | 3,065.9 | 3,833.6 | 3,532.3 | 2,227.2 | 3,238.5 | 3,059.8 | 3,166.4 | 3,111.1 | 3,599.2 |
| 2000's | 2,857.7 | 3,637.2 | 2,645.9 | 2,452.0 | 2,714.1 | 3,216.4 | 2,651.6 | 3,263.4 | 2,672.2 | 3,671.1 |
| 2010's | 3,871.2 | 4,457.3 | 5,556.4 | 5,266.8 | 4,854.1 | 5,557.9 | 6,124.0 | 5,127.6 | 3,552.6 | 3,011.2 |
| 2020's | 3,176.2 |
| - = No Data Reported; -- = Not Applicable; NA = Not Available; W = Withheld to avoid disclosure of individual company data. |
| Release Date: 6/1/2022 |
| Next Release Date: TBD |