|
Download Data (XLS File) |
|
||||||||
|
||||||||
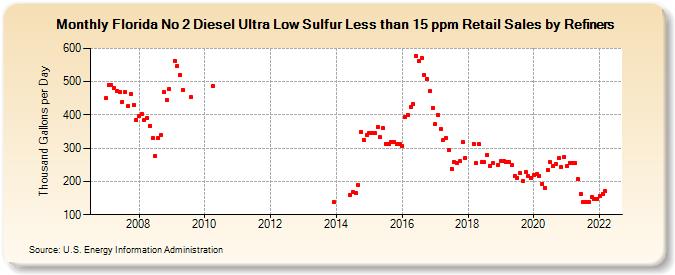
| Florida No 2 Diesel Ultra Low Sulfur Less than 15 ppm Retail Sales by Refiners (Thousand Gallons per Day) | ||||||||
| Year | Jan | Feb | Mar | Apr | May | Jun | Jul | Aug | Sep | Oct | Nov | Dec |
|---|---|---|---|---|---|---|---|---|---|---|---|---|
| 2007 | 449.7 | 490.0 | 489.4 | 480.9 | 472.5 | 469.4 | 439.9 | 468.0 | 426.5 | 462.1 | 431.1 | 385.1 |
| 2008 | 396.8 | 402.4 | 384.6 | 391.3 | 367.5 | 329.9 | 277.2 | 329.8 | 339.7 | 468.0 | 445.0 | 477.0 |
| 2009 | W | 562.1 | 546.5 | 520.5 | 475.1 | W | W | 453.2 | W | W | W | W |
| 2010 | W | W | W | 487.1 | W | W | W | W | W | W | W | W |
| 2011 | W | W | W | W | W | W | W | W | W | W | W | W |
| 2012 | W | W | W | W | W | W | W | W | W | W | W | W |
| 2013 | W | W | W | W | W | W | W | W | W | W | W | 138.2 |
| 2014 | W | W | W | W | W | 160.2 | 168.3 | 164.0 | 188.7 | 348.8 | 326.1 | 339.3 |
| 2015 | 346.4 | 345.7 | 344.7 | 364.2 | 332.8 | 359.2 | 312.8 | 312.2 | 317.5 | 318.1 | 313.7 | 312.4 |
| 2016 | 306.3 | 393.4 | 400.2 | 424.6 | 433.8 | 578.3 | 562.5 | 571.3 | 520.1 | 508.7 | 471.7 | 422.0 |
| 2017 | 371.4 | 400.9 | 358.8 | 326.0 | 331.9 | 293.1 | 238.8 | 258.4 | 255.5 | 260.5 | 318.3 | 270.6 |
| 2018 | W | W | 313.6 | 255.2 | 311.5 | 258.0 | 257.7 | 278.9 | 247.2 | 255.6 | W | 250.2 |
| 2019 | 262.9 | 261.7 | 259.4 | 257.1 | 249.7 | 217.3 | 211.2 | 224.1 | 202.0 | 227.8 | 215.1 | 209.0 |
| 2020 | 218.2 | 221.4 | 216.8 | 193.5 | 181.6 | 233.7 | 257.1 | 246.3 | 251.8 | 269.0 | 242.4 | 273.9 |
| 2021 | 247.5 | 255.7 | 255.0 | 254.3 | 206.0 | 162.3 | 137.4 | 138.9 | 138.1 | 153.2 | 147.2 | 148.4 |
| 2022 | 157.1 | 161.7 | 170.5 | |||||||||
| - = No Data Reported; -- = Not Applicable; NA = Not Available; W = Withheld to avoid disclosure of individual company data. |
| Release Date: 6/1/2022 |
| Next Release Date: TBD |