|
Download Data (XLS File) |
|
||||||||
|
||||||||
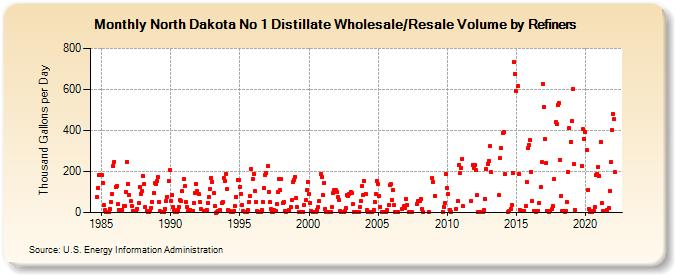
| North Dakota No 1 Distillate Wholesale/Resale Volume by Refiners (Thousand Gallons per Day) | ||||||||
| Year | Jan | Feb | Mar | Apr | May | Jun | Jul | Aug | Sep | Oct | Nov | Dec |
|---|---|---|---|---|---|---|---|---|---|---|---|---|
| 1984 | 76.8 | 119.4 | 184.6 | 181.9 | ||||||||
| 1985 | 184.0 | 144.4 | 34.9 | 11.1 | 4.6 | 4.1 | 2.5 | 16.8 | 53.8 | 91.9 | 228.0 | 247.8 |
| 1986 | 123.6 | 130.9 | 39.8 | 13.4 | 8.7 | 5.9 | 14.8 | 30.7 | 30.5 | 101.1 | 247.8 | 139.6 |
| 1987 | 86.7 | 54.7 | 34.3 | 9.8 | 8.8 | 5.4 | 9.5 | 19.6 | 45.8 | 123.7 | 92.5 | 104.0 |
| 1988 | 179.1 | 140.0 | 28.3 | 5.6 | 1.9 | 3.5 | 9.9 | 23.5 | 53.5 | 95.2 | 143.1 | 137.7 |
| 1989 | 154.2 | 174.3 | 53.6 | 5.6 | 1.4 | 4.0 | 2.6 | 19.0 | 56.1 | 77.3 | 154.0 | 206.1 |
| 1990 | 56.6 | 83.5 | 27.9 | 10.1 | 4.7 | 3.6 | 10.5 | 25.3 | 61.5 | 55.8 | 104.4 | 161.3 |
| 1991 | 128.1 | 51.6 | 29.0 | 6.0 | 5.7 | 14.6 | 9.3 | 7.9 | 47.8 | 96.7 | 140.6 | 104.6 |
| 1992 | 90.1 | 51.5 | 17.9 | W | W | 5.5 | W | 13.3 | 49.0 | 75.9 | 115.1 | 169.6 |
| 1993 | 149.6 | 95.2 | 32.4 | 0.0 | 3.2 | 6.2 | 7.9 | 10.5 | 45.6 | 50.4 | 168.3 | 153.5 |
| 1994 | 189.4 | 114.6 | 14.3 | 5.3 | 3.3 | 3.6 | 2.7 | 9.8 | 30.4 | 76.4 | 157.6 | 159.3 |
| 1995 | 125.5 | 90.5 | 37.6 | 5.9 | 2.9 | 1.4 | 4.5 | 12.5 | 52.1 | 80.2 | 212.8 | 165.2 |
| 1996 | 189.9 | 103.8 | 53.8 | 9.0 | 3.0 | 1.9 | 5.1 | 13.4 | 52.7 | 119.9 | 181.6 | 191.3 |
| 1997 | 226.2 | 101.8 | 51.1 | 15.0 | 3.1 | 3.5 | 11.1 | 8.4 | 39.8 | 98.3 | 164.0 | 107.6 |
| 1998 | 162.6 | 48.9 | 51.8 | 6.1 | 4.0 | 6.0 | 7.3 | 10.7 | 26.7 | 62.4 | 149.5 | 159.6 |
| 1999 | 173.8 | 72.0 | 26.5 | 3.5 | 2.0 | 2.3 | 3.1 | 4.4 | 37.4 | 58.9 | 108.0 | 150.7 |
| 2000 | 91.7 | 48.1 | 9.2 | 2.7 | 1.3 | 1.6 | 3.3 | 12.4 | 26.9 | 57.3 | 187.2 | 174.0 |
| 2001 | 87.2 | 146.0 | 17.7 | 2.0 | 0.8 | 2.5 | 3.6 | 3.3 | 25.2 | 92.9 | 109.1 | 112.0 |
| 2002 | 98.8 | 76.6 | 62.7 | 6.2 | 1.6 | 2.1 | 2.5 | 8.7 | 24.0 | 83.2 | 81.1 | 90.0 |
| 2003 | 101.7 | 95.8 | 41.1 | 3.3 | 1.3 | 0.8 | 2.7 | 4.3 | 28.4 | 56.2 | 127.4 | 85.5 |
| 2004 | 155.6 | 91.0 | 13.3 | 1.1 | 1.6 | 2.0 | 2.0 | 4.0 | 12.8 | 52.3 | 91.3 | 153.5 |
| 2005 | 138.5 | 80.9 | 26.0 | 2.3 | 1.7 | 2.6 | 2.2 | 4.9 | 11.9 | 36.4 | 133.3 | 138.4 |
| 2006 | 61.5 | 108.8 | 35.6 | 1.8 | 1.4 | 1.7 | W | W | W | 16.7 | 30.7 | 23.4 |
| 2007 | 67.0 | 38.3 | W | 0.9 | W | 0.9 | W | W | - | W | 41.7 | 58.3 |
| 2008 | 55.1 | 67.2 | 15.3 | 2.4 | W | W | W | W | 5.1 | W | W | 168.2 |
| 2009 | 148.3 | 82.5 | W | W | W | W | W | W | 4.7 | 28.6 | 47.8 | 188.5 |
| 2010 | 117.5 | 90.5 | 14.0 | 1.5 | W | W | W | W | 17.7 | 54.2 | 231.7 | 191.8 |
| 2011 | 218.6 | 263.4 | 30.0 | - | W | - | W | W | W | 56.5 | 232.0 | 219.5 |
| 2012 | 229.5 | 205.5 | 83.8 | 1.3 | 0.8 | W | 2.1 | 2.1 | 14.0 | 68.0 | 211.5 | 238.9 |
| 2013 | 252.8 | 322.6 | 195.9 | W | W | W | W | W | W | 84.7 | 264.1 | 312.3 |
| 2014 | 388.1 | 391.2 | 186.1 | W | W | 3.9 | 9.4 | 16.7 | 37.3 | 195.0 | 731.9 | 673.4 |
| 2015 | 590.9 | 618.1 | 189.9 | 14.6 | 5.7 | W | 6.2 | 9.1 | 31.3 | 149.5 | 313.9 | 331.4 |
| 2016 | 352.8 | 198.0 | 55.7 | 7.1 | 5.2 | 4.9 | 8.8 | 8.6 | 47.6 | 124.0 | 245.1 | 627.9 |
| 2017 | 514.0 | 358.1 | 240.7 | 6.5 | 4.7 | 6.3 | W | 16.1 | 30.1 | 163.6 | 439.3 | 429.3 |
| 2018 | 525.2 | 531.9 | 257.5 | 80.2 | 6.6 | 6.9 | 4.6 | 8.5 | 50.4 | 198.7 | 411.9 | 344.0 |
| 2019 | 445.8 | 604.2 | 235.1 | 13.4 | W | W | W | W | W | 227.4 | 405.8 | 360.3 |
| 2020 | 392.6 | 305.4 | 109.2 | 15.9 | 4.5 | 6.4 | 4.5 | 8.5 | 25.5 | 181.1 | 188.3 | 221.7 |
| 2021 | 178.7 | 345.5 | 45.3 | 7.6 | 5.3 | 5.9 | 6.1 | 10.2 | 21.7 | 106.2 | 244.7 | 401.4 |
| 2022 | 480.6 | 453.8 | 195.5 | |||||||||
| - = No Data Reported; -- = Not Applicable; NA = Not Available; W = Withheld to avoid disclosure of individual company data. |
| Release Date: 6/1/2022 |
| Next Release Date: TBD |