|
Download Data (XLS File) |
|
||||||||
|
||||||||
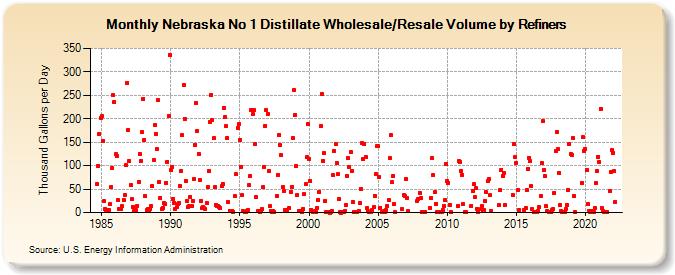
| Nebraska No 1 Distillate Wholesale/Resale Volume by Refiners (Thousand Gallons per Day) | ||||||||
| Year | Jan | Feb | Mar | Apr | May | Jun | Jul | Aug | Sep | Oct | Nov | Dec |
|---|---|---|---|---|---|---|---|---|---|---|---|---|
| 1984 | 61.2 | 99.7 | 168.0 | 202.0 | ||||||||
| 1985 | 205.3 | 153.0 | 23.8 | 8.1 | 5.6 | 4.6 | 4.5 | 17.3 | 55.0 | 95.5 | 250.1 | 235.9 |
| 1986 | 124.2 | 121.0 | 26.5 | 8.6 | 7.4 | 7.2 | 13.0 | 27.2 | 36.7 | 100.4 | 276.8 | 176.4 |
| 1987 | 110.0 | 58.3 | 28.0 | 11.9 | 3.4 | 3.9 | 4.8 | 14.1 | 65.8 | 125.3 | 110.7 | 171.1 |
| 1988 | 243.1 | 155.1 | 34.7 | 5.1 | 7.3 | 2.6 | 7.1 | 13.5 | 56.9 | 112.4 | 185.7 | 167.5 |
| 1989 | 134.5 | 239.3 | 65.9 | 31.9 | 6.9 | 10.7 | 19.8 | 18.7 | 63.8 | 108.1 | 205.6 | 336.9 |
| 1990 | 90.8 | 97.7 | 29.3 | 21.4 | 7.7 | 11.4 | 17.4 | 21.1 | 56.4 | 89.6 | 164.4 | 272.4 |
| 1991 | 199.6 | 66.9 | 25.4 | 12.0 | 13.3 | 33.2 | 13.7 | 25.4 | 71.5 | 145.0 | 233.3 | 173.9 |
| 1992 | 125.3 | 69.7 | 25.7 | 9.6 | 11.0 | 9.0 | 6.7 | 20.2 | 55.0 | 88.5 | 193.4 | 250.7 |
| 1993 | 196.6 | 158.1 | 53.5 | 17.0 | 13.8 | 13.3 | 11.6 | 9.5 | 56.1 | 61.1 | 223.9 | 202.8 |
| 1994 | 183.6 | 159.1 | 21.8 | 4.3 | 3.9 | 3.8 | 1.0 | W | 34.6 | 81.2 | 180.9 | 188.3 |
| 1995 | 154.5 | 98.1 | 36.6 | 2.5 | 1.9 | 1.6 | 4.3 | 6.0 | 59.0 | 78.1 | 219.2 | 210.0 |
| 1996 | 219.1 | 145.2 | 33.1 | W | 2.9 | 1.0 | 2.7 | 7.2 | 53.7 | 97.7 | 185.3 | 217.7 |
| 1997 | 210.5 | 89.4 | 13.0 | 4.2 | 1.6 | 3.4 | 1.6 | W | 35.7 | 80.8 | 166.1 | 143.1 |
| 1998 | 121.7 | 53.6 | 45.6 | 4.5 | 3.3 | 4.5 | NA | 10.2 | 44.8 | 54.9 | 159.0 | 260.4 |
| 1999 | 208.5 | 98.6 | 37.0 | 3.6 | 3.3 | 3.2 | 2.2 | 7.5 | 38.8 | 60.0 | 117.9 | 188.1 |
| 2000 | 113.9 | 68.0 | 6.5 | 2.0 | 1.2 | 3.2 | 1.3 | 10.6 | 27.0 | 43.9 | 184.2 | 253.3 |
| 2001 | 110.8 | 127.2 | 25.4 | 1.3 | 0.3 | 0.6 | 0.1 | 0.3 | 3.8 | 79.2 | 131.3 | 145.5 |
| 2002 | 105.9 | 81.6 | 28.6 | 2.1 | 0.1 | 0.9 | 1.6 | 3.6 | 15.8 | 78.7 | 116.2 | 97.5 |
| 2003 | 128.1 | 89.4 | 23.0 | 1.6 | 0.9 | 1.6 | 1.9 | 3.1 | 20.1 | 51.0 | 147.3 | 114.1 |
| 2004 | 146.9 | 118.4 | 9.4 | 3.4 | 2.0 | 1.1 | 2.2 | 5.3 | 11.0 | 36.1 | 81.3 | 141.7 |
| 2005 | 141.0 | 75.4 | 10.5 | 1.3 | 1.5 | 2.7 | 0.7 | 5.9 | 14.4 | 27.0 | 115.5 | 164.8 |
| 2006 | 64.2 | 78.2 | 18.0 | 1.0 | W | - | - | W | W | 7.4 | 36.5 | 34.7 |
| 2007 | 71.9 | 30.3 | 2.3 | - | W | W | W | W | W | W | 23.9 | 28.8 |
| 2008 | 42.3 | 31.7 | 2.0 | 0.8 | W | 0.9 | W | W | W | 10.7 | 31.1 | 116.2 |
| 2009 | 79.2 | 43.1 | 19.1 | 1.0 | - | 0.2 | W | 1.1 | 5.9 | 13.8 | 27.1 | 104.3 |
| 2010 | 66.9 | 63.9 | 16.6 | 0.8 | W | W | W | W | W | 14.6 | 108.9 | 107.1 |
| 2011 | 89.2 | 80.2 | 17.7 | 1.4 | 1.3 | W | W | W | W | 14.9 | 46.2 | 60.3 |
| 2012 | 32.3 | 51.4 | 8.3 | 1.2 | W | 6.7 | 14.4 | 3.6 | 4.6 | 25.1 | 42.8 | 66.4 |
| 2013 | 71.8 | 36.4 | 3.2 | W | - | - | - | W | - | 15.5 | 47.7 | 91.7 |
| 2014 | 77.6 | 84.7 | 15.3 | W | W | W | W | W | W | 37.5 | 145.2 | 117.7 |
| 2015 | 105.5 | 47.3 | 5.1 | W | W | W | W | 5.7 | 10.2 | 47.5 | 93.4 | 117.0 |
| 2016 | 108.9 | 55.6 | 7.3 | 1.5 | 1.2 | W | 1.2 | 4.0 | 11.2 | 35.5 | 105.6 | 194.5 |
| 2017 | 90.9 | 77.0 | 13.0 | 3.2 | 1.2 | 1.7 | 1.8 | 5.2 | 7.7 | 42.2 | 130.4 | 171.9 |
| 2018 | 134.5 | 84.4 | 15.7 | 3.4 | 1.4 | 1.5 | 1.8 | 7.6 | 16.5 | 47.8 | 145.8 | 124.0 |
| 2019 | 123.4 | 159.2 | 35.5 | 1.6 | W | W | W | W | W | 63.3 | 160.5 | 131.9 |
| 2020 | 135.1 | 90.7 | 18.2 | 3.3 | 1.1 | 1.6 | 2.3 | 1.7 | 10.5 | 62.3 | 89.5 | 119.4 |
| 2021 | 107.8 | 221.5 | 10.5 | 3.0 | 1.2 | W | W | 2.1 | W | 45.9 | 87.3 | 133.6 |
| 2022 | 128.0 | 88.4 | 23.3 | |||||||||
| - = No Data Reported; -- = Not Applicable; NA = Not Available; W = Withheld to avoid disclosure of individual company data. |
| Release Date: 6/1/2022 |
| Next Release Date: TBD |