|
Download Data (XLS File) |
|
||||||||
|
||||||||
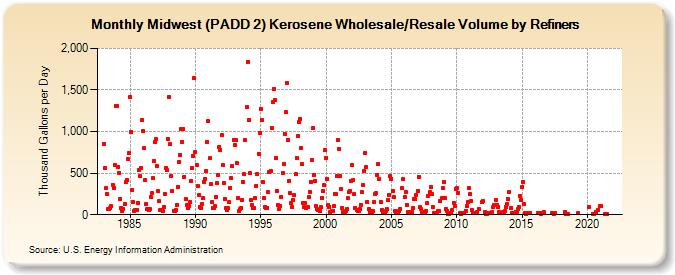
| Midwest (PADD 2) Kerosene Wholesale/Resale Volume by Refiners (Thousand Gallons per Day) | ||||||||
| Year | Jan | Feb | Mar | Apr | May | Jun | Jul | Aug | Sep | Oct | Nov | Dec |
|---|---|---|---|---|---|---|---|---|---|---|---|---|
| 1983 | 855.0 | 560.3 | 317.8 | 249.7 | 72.4 | 68.1 | 78.1 | 104.6 | 359.7 | 324.2 | 600.7 | 1,311.7 |
| 1984 | 1,310.6 | 577.0 | 505.8 | 194.9 | 83.6 | 46.7 | 65.3 | 131.1 | 390.0 | 422.3 | 675.0 | 744.3 |
| 1985 | 1,416.5 | 1,000.1 | 297.7 | 155.3 | 47.8 | 59.2 | 55.1 | 142.9 | 538.6 | 464.3 | 556.2 | 1,139.1 |
| 1986 | 1,003.0 | 801.9 | 418.9 | 129.7 | 69.9 | 53.3 | 67.2 | 215.5 | 255.1 | 435.6 | 647.5 | 874.7 |
| 1987 | 911.4 | 583.6 | 281.3 | 159.3 | 59.2 | 60.6 | 47.5 | 95.0 | 254.6 | 566.1 | 536.9 | 911.8 |
| 1988 | 1,418.7 | 846.5 | 466.5 | 284.6 | 48.3 | 43.6 | 60.2 | 118.9 | 338.2 | 631.0 | 720.5 | 1,028.8 |
| 1989 | 878.8 | 1,031.6 | 457.8 | 185.1 | 115.8 | 86.6 | 106.3 | 149.5 | 402.4 | 567.1 | 710.1 | 1,646.7 |
| 1990 | 750.1 | 596.8 | 345.1 | 237.7 | 92.0 | 85.1 | 128.5 | 196.5 | 398.5 | 433.9 | 524.2 | 878.7 |
| 1991 | 1,122.0 | 676.8 | 365.7 | 149.7 | 81.2 | 82.3 | 99.9 | 215.0 | 383.6 | 475.7 | 815.4 | 780.1 |
| 1992 | 955.0 | 592.0 | 381.6 | 193.9 | 75.2 | 53.3 | 74.9 | 147.5 | 321.6 | 436.2 | 581.3 | 904.3 |
| 1993 | 839.4 | 894.4 | 625.4 | 198.3 | 49.7 | 63.2 | 79.7 | 178.5 | 395.8 | 488.6 | 893.2 | 1,301.1 |
| 1994 | 1,839.7 | 1,143.8 | 496.9 | 178.9 | 114.2 | 77.0 | 84.4 | 195.9 | 349.6 | 484.0 | 734.8 | 979.6 |
| 1995 | 1,274.3 | 1,139.1 | 392.3 | 196.4 | 95.4 | 86.7 | 86.0 | 267.6 | 518.7 | 529.8 | 1,041.5 | 1,353.3 |
| 1996 | 1,515.0 | 1,379.3 | 681.2 | 289.3 | 112.9 | 73.4 | 99.1 | 211.3 | 506.7 | 606.2 | 970.3 | 1,231.0 |
| 1997 | 1,577.9 | 903.6 | 407.7 | 261.5 | 136.0 | 88.6 | 172.8 | 233.4 | 484.6 | 685.2 | 944.7 | 1,113.5 |
| 1998 | 1,146.6 | 808.0 | 605.0 | 143.9 | 91.4 | 134.9 | 82.8 | 89.5 | 209.6 | 277.5 | 397.6 | 654.5 |
| 1999 | 1,038.5 | 481.0 | 404.0 | 101.0 | 63.4 | 58.9 | 50.5 | 88.9 | 206.8 | 285.5 | 354.1 | 777.8 |
| 2000 | 685.5 | 433.3 | 115.7 | 94.6 | 35.7 | 43.4 | 50.3 | 101.2 | 254.3 | 243.7 | 461.2 | 904.2 |
| 2001 | 791.4 | 461.6 | 310.9 | 81.5 | 30.3 | 31.3 | 47.1 | 66.1 | 199.9 | 268.1 | 280.8 | 405.5 |
| 2002 | 594.1 | 418.3 | 251.3 | 82.4 | 50.8 | 39.9 | 39.4 | 73.9 | 120.4 | 271.6 | 352.6 | 525.1 |
| 2003 | 743.2 | 567.9 | 156.7 | 66.5 | 28.2 | 29.5 | 31.8 | 48.6 | 156.7 | 244.9 | 260.3 | 478.4 |
| 2004 | 607.5 | 426.6 | 157.9 | 60.8 | 26.1 | 32.9 | 31.8 | 46.1 | 67.9 | 181.8 | 240.0 | 470.9 |
| 2005 | 434.5 | 279.5 | 214.3 | 44.5 | 35.0 | 35.2 | 31.6 | 45.4 | 71.1 | NA | 320.9 | 427.0 |
| 2006 | 214.4 | 273.4 | 120.8 | 32.0 | 27.7 | 20.6 | 21.4 | 32.3 | 83.1 | 183.9 | 184.5 | 239.7 |
| 2007 | 287.6 | 457.1 | 87.1 | 67.3 | 25.0 | 20.2 | 30.0 | 25.9 | 47.6 | 135.8 | 229.6 | 268.6 |
| 2008 | 333.3 | 243.6 | 95.8 | 26.2 | 15.9 | 15.5 | 26.6 | 40.2 | 44.0 | 161.5 | 197.0 | 320.1 |
| 2009 | 396.8 | 206.7 | 71.4 | 46.1 | 13.2 | 12.4 | 21.5 | 24.5 | 61.2 | 143.3 | 107.2 | 308.6 |
| 2010 | 324.1 | 265.5 | W | 18.8 | 12.7 | 16.9 | 24.0 | 26.5 | 47.9 | 104.1 | 154.8 | 320.1 |
| 2011 | 247.6 | 166.4 | 62.5 | 25.8 | 15.0 | 19.3 | 19.8 | 36.1 | 71.0 | W | W | 147.9 |
| 2012 | 161.9 | W | 31.7 | 13.5 | 13.9 | 18.8 | W | 17.7 | 32.9 | 89.5 | 111.1 | 117.2 |
| 2013 | 177.2 | 119.3 | 90.5 | 32.1 | 19.5 | 25.0 | 30.3 | 27.1 | 47.8 | 94.7 | 124.2 | 190.3 |
| 2014 | 275.4 | W | 81.9 | 23.7 | 14.7 | 15.1 | 34.1 | 33.9 | 66.6 | 93.5 | 229.6 | 181.7 |
| 2015 | 337.2 | 397.8 | 122.9 | 20.6 | 12.2 | 16.3 | W | 26.2 | W | W | W | W |
| 2016 | W | W | W | 22.6 | 15.4 | 11.6 | 14.9 | W | 31.5 | W | W | W |
| 2017 | W | W | W | 16.7 | W | 14.1 | 17.7 | W | W | W | W | W |
| 2018 | W | W | W | 30.0 | 10.8 | 10.0 | 11.3 | W | W | W | W | W |
| 2019 | W | W | W | 15.4 | W | W | W | W | W | W | W | W |
| 2020 | W | 88.7 | W | W | W | 9.6 | 12.6 | W | 30.5 | W | 60.9 | 104.7 |
| 2021 | 109.5 | W | W | W | 7.9 | 7.8 | 8.9 | W | W | W | W | W |
| 2022 | W | W | W | |||||||||
| - = No Data Reported; -- = Not Applicable; NA = Not Available; W = Withheld to avoid disclosure of individual company data. |
| Release Date: 6/1/2022 |
| Next Release Date: TBD |