|
Download Data (XLS File) |
|
||||||||
|
||||||||
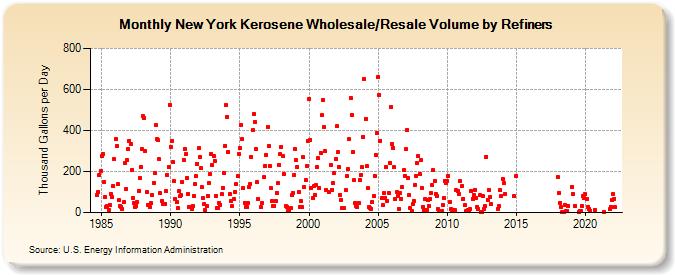
| New York Kerosene Wholesale/Resale Volume by Refiners (Thousand Gallons per Day) | ||||||||
| Year | Jan | Feb | Mar | Apr | May | Jun | Jul | Aug | Sep | Oct | Nov | Dec |
|---|---|---|---|---|---|---|---|---|---|---|---|---|
| 1984 | 84.5 | 101.2 | 184.1 | 203.8 | ||||||||
| 1985 | 276.3 | 285.9 | 149.0 | 77.1 | 25.7 | 33.6 | 14.7 | 37.4 | 90.8 | 78.2 | 129.1 | 258.6 |
| 1986 | 358.6 | 324.6 | 137.2 | 59.4 | 34.0 | 27.9 | 17.3 | 49.5 | 242.4 | 115.4 | 255.7 | 307.8 |
| 1987 | 349.2 | 336.5 | 208.3 | 69.9 | 47.4 | 26.5 | 33.6 | 51.8 | 107.0 | 168.5 | 222.1 | 309.5 |
| 1988 | 468.6 | 461.1 | 298.4 | 101.7 | 37.1 | 36.7 | 26.2 | 44.3 | 84.4 | 144.8 | 190.5 | 425.2 |
| 1989 | 358.2 | 351.7 | 259.6 | 94.5 | 56.8 | 39.4 | W | 44.0 | 103.0 | 181.9 | 221.1 | 525.4 |
| 1990 | 321.6 | 348.2 | 245.8 | 152.2 | 67.1 | 49.2 | 20.0 | 103.2 | 78.3 | 83.7 | 149.9 | 258.4 |
| 1991 | 309.5 | 284.6 | 169.8 | 91.0 | 28.4 | 25.0 | 17.9 | 34.0 | 80.7 | 138.5 | 179.2 | 238.3 |
| 1992 | 312.3 | 269.0 | 215.6 | 122.8 | 70.8 | 42.6 | 10.1 | 32.7 | 80.7 | 144.1 | 187.3 | 283.5 |
| 1993 | 231.2 | 276.6 | 253.1 | 79.6 | 23.2 | 23.2 | 46.4 | 38.3 | 88.8 | 120.9 | 193.9 | 324.4 |
| 1994 | 524.1 | 467.6 | 295.7 | 89.3 | 58.7 | 30.7 | W | 65.3 | 100.6 | 137.7 | 177.9 | 285.5 |
| 1995 | 314.1 | 426.3 | 358.4 | 117.3 | 47.0 | 29.0 | 26.0 | 46.2 | 125.7 | 140.7 | 271.3 | 401.1 |
| 1996 | 481.6 | 442.0 | 308.3 | 147.4 | 68.0 | W | 25.5 | 49.0 | W | 172.0 | 228.4 | 282.7 |
| 1997 | 418.7 | 323.8 | 226.6 | 117.5 | 57.6 | 33.2 | 32.1 | 55.2 | 97.3 | 142.0 | 232.3 | 284.1 |
| 1998 | 321.9 | 274.6 | 188.2 | W | 31.0 | 27.8 | 6.4 | 9.8 | 21.1 | 83.4 | 96.0 | 182.1 |
| 1999 | 307.9 | 253.7 | 222.5 | 101.2 | 27.9 | 54.8 | 24.7 | 268.4 | 124.6 | 158.5 | 227.5 | 350.1 |
| 2000 | 553.6 | 355.0 | 120.7 | 70.0 | 129.0 | 86.5 | 134.1 | 220.7 | 263.8 | 120.3 | 291.9 | 473.2 |
| 2001 | 549.3 | 415.8 | 297.7 | 110.5 | W | 101.0 | W | 232.0 | 110.4 | 142.4 | 191.8 | 259.2 |
| 2002 | 419.8 | 293.7 | 223.9 | 86.1 | 60.4 | 22.5 | 21.5 | W | 108.5 | 176.7 | 210.2 | 357.8 |
| 2003 | 557.8 | 474.4 | 297.5 | 156.3 | 46.9 | 31.0 | 25.8 | 46.8 | 158.6 | 185.0 | 220.5 | 368.3 |
| 2004 | 651.8 | 457.7 | 224.9 | 117.3 | 25.9 | 20.5 | 18.2 | 52.4 | 80.2 | 177.1 | 280.0 | 388.5 |
| 2005 | 662.9 | 572.2 | 350.4 | 70.4 | 36.4 | 94.1 | 71.4 | 223.0 | 58.5 | 96.9 | 242.3 | 516.0 |
| 2006 | 334.8 | 315.9 | 220.5 | 63.8 | 99.3 | 81.3 | 19.1 | 94.1 | 67.7 | 122.2 | 206.1 | 180.2 |
| 2007 | 308.0 | 403.1 | 167.5 | 83.6 | 20.6 | 8.8 | 42.5 | 58.2 | 134.5 | 179.2 | 241.8 | 275.1 |
| 2008 | 187.2 | 253.7 | 120.2 | 28.8 | 13.5 | 66.8 | 13.2 | 61.9 | 31.0 | 66.3 | 96.5 | 134.7 |
| 2009 | 206.9 | 156.2 | 90.5 | 80.3 | 17.0 | 8.9 | 6.1 | 8.1 | 39.0 | 72.3 | 153.7 | 144.5 |
| 2010 | 153.5 | 177.5 | 50.8 | 15.6 | 12.6 | 14.6 | 5.7 | 10.6 | 107.7 | 102.8 | 89.3 | 152.1 |
| 2011 | W | 129.5 | 68.3 | 34.6 | 7.6 | NA | 11.9 | 9.2 | 15.7 | 105.5 | 67.4 | 86.0 |
| 2012 | 110.5 | 72.8 | 27.7 | 18.0 | 83.5 | 3.2 | 4.6 | 78.9 | 17.0 | 29.9 | 272.7 | 63.4 |
| 2013 | 110.0 | 75.1 | 39.7 | W | W | W | W | W | 17.4 | 30.1 | 107.9 | 83.1 |
| 2014 | 165.3 | 142.0 | 90.9 | W | W | W | W | W | W | W | 81.6 | W |
| 2015 | 179.1 | W | W | W | W | W | W | W | W | W | W | W |
| 2016 | W | W | W | W | W | W | W | W | W | W | W | W |
| 2017 | W | W | W | W | W | W | W | W | W | W | W | W |
| 2018 | 171.3 | 97.2 | 47.0 | 27.0 | 4.7 | 2.6 | 38.3 | 5.6 | 9.4 | 32.2 | W | W |
| 2019 | 126.1 | 91.1 | W | 32.7 | W | W | 1.9 | 5.2 | 9.8 | 31.6 | 79.0 | 70.8 |
| 2020 | 88.5 | 64.0 | 27.4 | 16.4 | 9.2 | W | W | W | 12.0 | W | W | W |
| 2021 | W | W | W | W | 5.1 | W | W | W | W | 15.1 | 27.6 | 61.0 |
| 2022 | 92.2 | 67.8 | 25.8 | |||||||||
| - = No Data Reported; -- = Not Applicable; NA = Not Available; W = Withheld to avoid disclosure of individual company data. |
| Release Date: 6/1/2022 |
| Next Release Date: TBD |