|
Download Data (XLS File) |
|
||||||||
|
||||||||
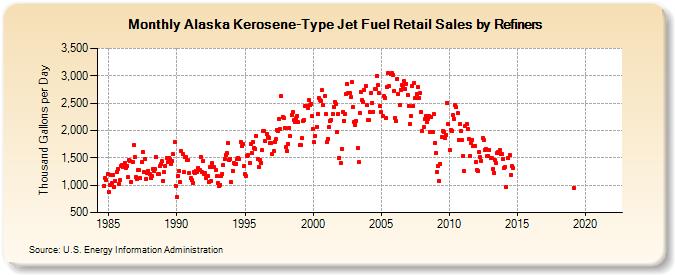
| Alaska Kerosene-Type Jet Fuel Retail Sales by Refiners (Thousand Gallons per Day) | ||||||||
| Year | Jan | Feb | Mar | Apr | May | Jun | Jul | Aug | Sep | Oct | Nov | Dec |
|---|---|---|---|---|---|---|---|---|---|---|---|---|
| 1984 | 993.5 | 1,136.7 | 1,087.0 | 1,197.9 | ||||||||
| 1985 | 881.7 | 1,003.8 | 1,187.5 | 1,044.1 | 1,188.9 | 963.8 | 1,080.4 | 1,239.9 | 1,302.1 | 1,029.7 | 1,088.1 | 1,346.3 |
| 1986 | 1,365.8 | 1,338.6 | 1,414.4 | 1,308.5 | 1,356.5 | 1,149.5 | 1,456.5 | 1,437.2 | 1,066.8 | 1,427.2 | 1,725.9 | 1,512.2 |
| 1987 | 1,141.5 | 1,121.3 | 1,277.5 | 1,269.3 | 1,128.2 | 1,420.4 | 1,607.7 | 1,243.6 | 1,475.4 | 1,115.7 | 1,224.3 | 1,267.8 |
| 1988 | 1,199.9 | 1,126.5 | 1,163.3 | 1,304.9 | 1,253.0 | 1,295.0 | 1,513.5 | 1,197.6 | 1,203.3 | 1,345.7 | 1,391.9 | 1,436.6 |
| 1989 | 1,085.3 | 1,238.1 | 1,351.1 | 1,495.0 | 1,417.9 | 1,490.7 | 1,475.8 | 1,390.2 | 1,449.2 | 1,562.1 | 1,789.8 | 991.9 |
| 1990 | 786.2 | 1,165.4 | 1,265.3 | 1,056.0 | 1,618.7 | 1,578.6 | 1,232.4 | 1,516.5 | 1,510.7 | 1,468.0 | 1,453.1 | 1,227.8 |
| 1991 | 1,122.6 | 1,091.1 | 1,045.6 | 1,237.8 | 1,222.1 | 1,264.4 | 1,245.1 | 1,322.7 | 1,285.9 | 1,520.3 | 1,241.7 | 1,440.1 |
| 1992 | 1,208.2 | 1,215.1 | 1,130.4 | 1,168.5 | 1,061.8 | 1,326.9 | 1,077.0 | 1,404.2 | 1,324.5 | 1,327.8 | 1,271.6 | 1,162.6 |
| 1993 | 1,033.5 | 990.9 | 1,010.1 | 1,165.8 | 1,210.9 | 1,367.2 | 1,478.7 | 1,553.9 | 1,581.2 | 1,774.7 | 1,460.4 | 1,483.6 |
| 1994 | 1,055.3 | 1,261.6 | 1,410.5 | 1,392.2 | 1,388.9 | 1,473.8 | 1,503.9 | 1,476.0 | 1,797.4 | 1,720.4 | 1,752.2 | 1,351.8 |
| 1995 | 1,196.2 | 1,164.1 | 1,539.6 | 1,547.7 | 1,414.7 | 1,748.9 | 1,587.0 | 1,795.0 | 1,685.1 | 1,662.7 | 1,895.6 | 1,478.1 |
| 1996 | 1,341.4 | 1,467.5 | 1,412.9 | 1,638.2 | 1,985.8 | 1,986.9 | 1,800.0 | 1,930.6 | 1,887.1 | 1,870.2 | 1,779.2 | 1,771.6 |
| 1997 | 1,573.6 | 1,619.1 | 1,797.5 | 1,835.4 | 2,011.6 | 1,998.0 | 2,204.6 | 2,018.9 | 2,622.6 | 2,241.5 | 2,223.9 | 2,053.7 |
| 1998 | 1,696.8 | 1,623.4 | 1,755.7 | 2,053.1 | 1,890.8 | 2,282.6 | 2,332.5 | 2,194.3 | 2,151.2 | 2,219.7 | 2,273.4 | 2,146.5 |
| 1999 | 1,730.1 | 1,732.5 | 1,857.6 | 2,165.7 | 2,184.1 | 2,440.4 | 2,452.2 | 2,415.4 | 2,552.9 | 2,466.0 | 2,487.4 | 2,267.4 |
| 2000 | 2,026.1 | 1,783.0 | 1,897.8 | 2,069.9 | 2,302.4 | 2,587.8 | 2,562.6 | 2,539.3 | 2,732.3 | 2,457.6 | 2,630.1 | 2,303.4 |
| 2001 | 1,785.0 | 1,850.2 | 2,065.2 | 2,171.4 | 2,197.8 | 2,296.6 | 2,430.4 | 2,526.5 | 2,485.8 | 1,981.0 | 2,307.2 | 1,503.1 |
| 2002 | 1,407.1 | 1,667.6 | 2,344.2 | 2,179.0 | 2,308.6 | 2,674.8 | 2,849.1 | 2,678.3 | 2,686.5 | 2,605.6 | 2,882.7 | 2,427.6 |
| 2003 | 2,159.3 | 2,105.4 | 2,164.9 | 1,684.6 | 1,418.6 | 2,325.2 | 2,704.9 | 2,552.6 | 2,516.0 | 2,746.1 | 2,812.9 | 2,462.3 |
| 2004 | 2,190.8 | 2,198.3 | 2,346.5 | 2,690.4 | 2,508.0 | 2,344.3 | 2,750.5 | 2,750.5 | 2,997.0 | 2,826.2 | 2,683.7 | 2,440.3 |
| 2005 | 2,334.1 | 2,265.2 | 2,623.2 | 2,601.7 | 2,226.6 | 2,790.2 | 3,049.8 | 2,806.8 | 3,025.6 | 3,050.4 | 3,019.1 | 2,715.0 |
| 2006 | 2,236.5 | 2,171.1 | 2,942.4 | 2,667.2 | 2,465.1 | 2,745.0 | 2,834.6 | 2,783.6 | 2,900.5 | 2,763.1 | 2,856.9 | 2,643.2 |
| 2007 | 2,447.5 | 2,116.4 | 2,270.8 | 2,821.2 | 2,449.9 | 2,876.0 | 2,596.6 | 2,666.9 | 2,796.3 | 2,594.7 | 2,687.8 | 2,341.3 |
| 2008 | 1,987.5 | 2,062.8 | 2,204.8 | 2,261.5 | 2,154.6 | 2,218.8 | 2,257.8 | 1,978.0 | 2,243.0 | 1,964.8 | 2,305.4 | 1,777.0 |
| 2009 | 1,580.4 | 1,244.8 | 1,352.7 | 1,070.5 | 1,394.3 | 1,885.9 | 1,987.6 | 1,979.2 | 1,860.3 | 1,924.4 | 2,511.0 | 2,113.6 |
| 2010 | 1,641.3 | 2,010.8 | 1,986.5 | 2,279.2 | 2,208.6 | 2,468.0 | 2,430.1 | 2,314.2 | 1,822.9 | 2,120.5 | 1,989.6 | 1,828.5 |
| 2011 | 1,542.3 | 1,252.9 | 2,072.9 | 2,113.7 | 2,029.2 | 1,849.0 | 1,536.3 | 1,776.1 | 1,830.0 | 1,725.4 | 1,724.6 | 1,424.8 |
| 2012 | 1,285.9 | 1,255.9 | 1,602.2 | 1,508.7 | 1,446.9 | 1,862.4 | 1,824.0 | 1,650.5 | 1,662.0 | 1,531.0 | 1,535.2 | 1,644.3 |
| 2013 | 1,495.8 | 1,494.2 | 1,286.9 | 1,230.7 | 1,455.6 | 1,400.3 | 1,581.4 | 1,601.6 | 1,641.5 | 1,566.1 | 1,571.3 | 1,483.4 |
| 2014 | 1,309.5 | 1,329.4 | 970.1 | 1,492.2 | W | 1,554.1 | 1,188.9 | 1,345.2 | 1,315.7 | W | W | W |
| 2015 | W | W | W | W | W | W | W | NA | NA | W | W | W |
| 2016 | W | W | W | W | W | W | W | W | W | W | W | W |
| 2017 | W | W | W | W | W | W | W | W | W | W | W | W |
| 2018 | W | W | W | W | W | W | W | W | W | W | W | W |
| 2019 | W | 948.8 | W | W | W | W | W | W | W | W | W | W |
| 2020 | W | W | W | W | W | W | W | W | W | W | W | W |
| 2021 | W | W | W | W | W | W | W | W | W | W | W | W |
| 2022 | W | W | W | |||||||||
| - = No Data Reported; -- = Not Applicable; NA = Not Available; W = Withheld to avoid disclosure of individual company data. |
| Release Date: 6/1/2022 |
| Next Release Date: TBD |