|
Download Data (XLS File) |
|
||||||||
|
||||||||
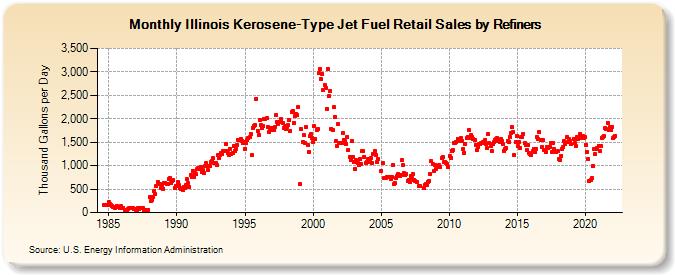
| Illinois Kerosene-Type Jet Fuel Retail Sales by Refiners (Thousand Gallons per Day) | ||||||||
| Year | Jan | Feb | Mar | Apr | May | Jun | Jul | Aug | Sep | Oct | Nov | Dec |
|---|---|---|---|---|---|---|---|---|---|---|---|---|
| 1984 | 163.7 | 168.5 | 159.6 | 165.6 | ||||||||
| 1985 | 222.1 | 177.3 | 155.9 | 143.0 | 124.8 | 127.9 | 101.8 | 141.5 | 112.8 | 127.8 | 105.8 | 131.4 |
| 1986 | 91.9 | 103.9 | 65.1 | 50.5 | 58.5 | 85.0 | 91.8 | 103.4 | 99.2 | 91.1 | 71.9 | 70.1 |
| 1987 | 62.5 | 60.3 | 93.4 | 86.3 | 105.4 | 91.0 | 86.8 | 36.0 | 52.8 | 60.5 | 53.8 | 56.2 |
| 1988 | 324.6 | 248.8 | 264.5 | 336.1 | 450.6 | 396.8 | 564.0 | 649.1 | 614.1 | 605.8 | 517.9 | 587.6 |
| 1989 | 508.0 | 635.3 | 626.7 | 614.7 | 602.3 | 716.4 | 741.9 | 631.5 | 672.1 | 685.4 | 534.1 | 572.2 |
| 1990 | 566.7 | 654.9 | 584.9 | 533.7 | 492.0 | 482.8 | 549.0 | 521.7 | 582.7 | 709.5 | 623.3 | 541.2 |
| 1991 | 796.3 | 747.5 | 892.1 | 747.5 | 837.3 | 814.9 | 919.1 | 949.0 | 933.4 | 969.8 | 863.4 | 904.6 |
| 1992 | 843.6 | 986.4 | 1,051.2 | 917.7 | 989.1 | 998.6 | 1,069.2 | 1,090.6 | 1,157.2 | 1,046.9 | 1,064.3 | 1,013.5 |
| 1993 | 1,221.3 | 1,173.7 | 1,236.7 | 1,265.4 | 1,255.0 | 1,314.3 | 1,302.4 | 1,455.2 | 1,306.6 | 1,260.2 | 1,224.4 | 1,361.7 |
| 1994 | 1,258.5 | 1,277.9 | 1,423.5 | 1,316.8 | 1,360.2 | 1,442.8 | 1,550.5 | 1,541.7 | 1,570.0 | 1,533.4 | 1,475.9 | 1,498.9 |
| 1995 | 1,361.5 | 1,476.0 | 1,544.7 | 1,592.2 | 1,604.9 | 1,680.6 | 1,218.6 | 1,811.9 | 1,856.0 | 1,863.9 | 2,427.1 | 1,749.2 |
| 1996 | 1,650.7 | 1,981.6 | 1,859.8 | 1,792.4 | 1,847.6 | 2,002.6 | 2,004.1 | 2,015.9 | 1,831.9 | 1,710.7 | 1,802.4 | 1,762.5 |
| 1997 | 1,801.0 | 1,762.6 | 1,817.6 | 2,072.9 | 1,941.0 | 1,895.6 | 1,922.3 | 1,939.3 | 1,985.6 | 1,916.1 | 1,801.5 | 1,842.6 |
| 1998 | 1,773.0 | 1,826.4 | 1,860.9 | 1,964.9 | 1,740.3 | 2,141.4 | 2,165.4 | 1,917.9 | 2,048.5 | 2,111.2 | 2,075.2 | 2,245.3 |
| 1999 | 600.2 | 1,775.1 | NA | 1,495.0 | 1,646.5 | 1,482.9 | 1,824.9 | 1,448.5 | 1,296.7 | 1,624.8 | 1,678.6 | 1,585.7 |
| 2000 | 1,505.2 | 1,835.9 | 1,559.7 | 1,766.4 | 1,772.3 | 2,975.2 | 3,056.3 | 2,846.4 | 2,959.0 | 2,613.0 | 2,714.4 | 2,661.0 |
| 2001 | 2,216.4 | 3,060.7 | 2,479.2 | 2,586.9 | 1,790.9 | 1,758.5 | 2,242.3 | 2,036.2 | 1,515.8 | 1,428.0 | 1,878.0 | 1,491.4 |
| 2002 | 1,475.2 | 1,473.4 | 1,686.7 | 1,542.2 | 1,527.2 | 1,458.9 | 1,616.3 | 1,344.1 | 1,183.7 | 1,125.0 | 1,529.8 | 1,187.5 |
| 2003 | 1,083.0 | 923.4 | 1,114.5 | 1,065.7 | 1,011.6 | 1,135.2 | 1,041.0 | 1,301.9 | 1,304.9 | 1,191.0 | 1,060.1 | 1,082.7 |
| 2004 | 1,133.5 | 1,085.5 | 1,078.8 | 1,160.3 | 1,060.8 | 1,253.4 | 1,307.1 | 1,217.0 | 1,085.2 | 1,138.5 | NA | NA |
| 2005 | 889.7 | 1,046.1 | 733.4 | 732.4 | 730.5 | 761.0 | 765.7 | 754.3 | 721.6 | 768.2 | 1,011.1 | 601.9 |
| 2006 | 622.1 | 736.7 | 780.6 | 822.3 | 777.6 | 806.2 | 1,110.6 | 1,006.5 | 832.8 | 798.5 | 818.7 | 675.6 |
| 2007 | 697.4 | 661.1 | 770.3 | 729.1 | 818.7 | 697.2 | 670.5 | 650.4 | W | 574.6 | 562.8 | W |
| 2008 | W | 516.8 | 586.8 | 603.9 | 586.8 | 657.5 | 679.0 | 826.8 | 1,095.4 | 1,042.3 | 876.6 | 1,004.0 |
| 2009 | 934.9 | 962.5 | 962.0 | 1,007.5 | 976.3 | 1,161.8 | 1,187.7 | 1,076.0 | 1,087.4 | 1,063.0 | 1,032.0 | 970.3 |
| 2010 | 1,206.7 | 1,170.6 | 1,317.3 | 1,335.8 | 1,488.7 | 1,492.0 | 1,503.2 | 1,577.4 | 1,564.1 | 1,522.6 | 1,583.5 | 1,527.1 |
| 2011 | 1,357.7 | 1,270.9 | 1,452.4 | 1,590.8 | 1,616.3 | 1,751.9 | 1,589.1 | 1,650.0 | 1,612.3 | 1,564.4 | 1,542.1 | 1,445.8 |
| 2012 | 1,326.5 | 1,389.7 | 1,462.1 | 1,452.9 | 1,476.5 | 1,498.6 | 1,474.0 | 1,551.2 | 1,461.4 | 1,373.3 | 1,664.7 | 1,476.3 |
| 2013 | 1,416.6 | 1,319.8 | 1,472.0 | 1,497.1 | 1,547.1 | 1,578.4 | 1,588.9 | 1,534.1 | 1,507.0 | 1,557.9 | 1,525.9 | 1,453.3 |
| 2014 | 1,319.7 | 1,344.7 | 1,372.0 | 1,526.3 | 1,514.4 | 1,619.5 | 1,691.9 | 1,814.1 | 1,720.6 | 1,225.7 | 1,502.5 | 1,642.0 |
| 2015 | 1,412.7 | 1,504.4 | 1,378.2 | 1,604.3 | 1,618.3 | 1,681.2 | 1,475.5 | 1,431.5 | 1,332.9 | 1,449.8 | 1,263.9 | 1,258.1 |
| 2016 | 1,226.4 | 1,302.1 | 1,363.8 | 1,285.4 | 1,361.8 | 1,620.4 | 1,573.3 | 1,722.2 | 1,539.5 | 1,400.6 | 1,537.8 | 1,339.1 |
| 2017 | 1,326.2 | 1,291.0 | 1,400.2 | 1,379.9 | 1,406.8 | 1,485.5 | 1,288.1 | 1,485.9 | 1,353.2 | NA | 1,294.2 | 1,306.0 |
| 2018 | 1,143.8 | 1,114.4 | 1,210.8 | 1,364.0 | 1,387.1 | 1,527.8 | 1,466.6 | 1,609.7 | 1,495.4 | 1,568.7 | 1,532.0 | 1,453.8 |
| 2019 | NA | 1,575.1 | 1,486.8 | 1,422.6 | 1,605.8 | 1,566.4 | 1,582.2 | 1,677.8 | 1,588.5 | 1,622.3 | 1,592.2 | 1,611.7 |
| 2020 | 1,446.0 | 1,292.7 | 1,138.6 | 668.9 | 689.9 | 735.9 | 983.2 | 1,348.4 | 1,238.5 | 1,350.9 | 1,384.1 | 1,419.7 |
| 2021 | 1,317.8 | 1,414.4 | 1,598.1 | 1,608.0 | 1,627.0 | 1,812.8 | 1,781.9 | 1,917.9 | 1,767.2 | 1,814.1 | 1,758.8 | 1,832.7 |
| 2022 | 1,582.1 | 1,620.0 | 1,633.4 | |||||||||
| - = No Data Reported; -- = Not Applicable; NA = Not Available; W = Withheld to avoid disclosure of individual company data. |
| Release Date: 6/1/2022 |
| Next Release Date: TBD |