|
Download Data (XLS File) |
|
||||||||
|
||||||||
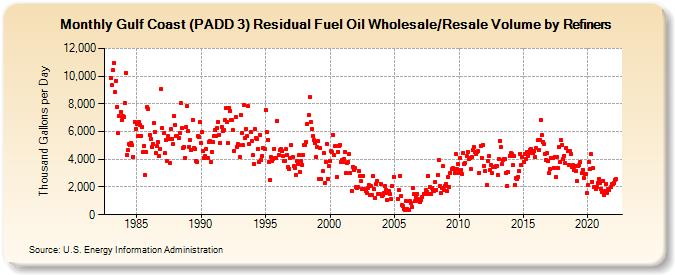
| Gulf Coast (PADD 3) Residual Fuel Oil Wholesale/Resale Volume by Refiners (Thousand Gallons per Day) | ||||||||
| Year | Jan | Feb | Mar | Apr | May | Jun | Jul | Aug | Sep | Oct | Nov | Dec |
|---|---|---|---|---|---|---|---|---|---|---|---|---|
| 1983 | 9,865.4 | 9,332.5 | 10,437.4 | 10,966.6 | 8,836.9 | 9,678.2 | 7,790.5 | 5,876.5 | 7,092.4 | 7,430.2 | 6,799.2 | 7,125.3 |
| 1984 | 7,068.3 | 8,068.7 | 10,251.7 | 4,298.1 | 4,639.6 | 5,128.5 | 5,050.1 | 5,177.4 | 4,995.8 | 4,192.2 | 6,692.2 | 6,219.0 |
| 1985 | 6,545.6 | 5,660.1 | 6,709.8 | 6,500.9 | 5,682.9 | 6,322.2 | 4,506.4 | 4,981.2 | 2,836.1 | 4,505.5 | 7,757.9 | 7,631.5 |
| 1986 | 5,775.7 | 5,474.0 | 4,893.4 | 5,122.3 | 6,624.6 | 6,000.8 | 4,470.6 | 4,934.8 | 5,227.4 | 4,221.7 | 4,741.4 | 9,054.0 |
| 1987 | 6,263.3 | 5,884.5 | 4,447.5 | 5,416.5 | 3,866.3 | 5,666.7 | 5,479.6 | 3,747.1 | 6,180.3 | 5,485.0 | 5,095.7 | 7,114.0 |
| 1988 | 6,504.2 | 5,707.6 | 5,653.5 | 5,526.2 | 5,878.5 | 8,035.7 | 6,227.2 | 4,804.2 | 4,886.3 | 4,114.4 | 6,339.4 | 7,816.2 |
| 1989 | 6,042.1 | 4,899.2 | 5,386.3 | 4,651.0 | 6,852.8 | 4,803.3 | 4,729.6 | 3,852.4 | 3,793.9 | 5,673.2 | 5,618.1 | 6,679.4 |
| 1990 | 5,173.9 | 5,943.3 | 4,585.1 | 4,056.1 | 4,248.6 | 4,736.9 | 4,093.5 | 5,262.7 | 5,328.2 | 3,775.7 | 4,540.2 | 5,231.1 |
| 1991 | 5,665.4 | 6,113.1 | 5,685.4 | 6,258.6 | 6,691.5 | 5,783.5 | 5,178.2 | 6,363.6 | 6,046.4 | 6,079.8 | 6,829.3 | 7,667.4 |
| 1992 | 6,675.8 | 5,180.6 | 7,680.5 | 7,494.8 | 6,859.5 | 6,802.4 | 6,076.4 | 4,589.1 | 7,062.7 | 4,888.8 | 5,116.5 | 5,016.2 |
| 1993 | 4,197.7 | 7,162.8 | 5,891.2 | 5,005.9 | 7,941.2 | 5,512.5 | 6,186.1 | 5,684.7 | 7,813.2 | 5,087.0 | 5,945.1 | 5,299.5 |
| 1994 | 4,276.7 | 3,676.1 | 6,194.3 | 5,538.3 | 5,434.3 | 4,762.6 | 3,778.5 | 5,739.8 | 3,946.5 | 4,245.0 | 4,820.3 | 4,718.8 |
| 1995 | 7,567.5 | 5,962.8 | 5,414.1 | 3,819.1 | 2,538.4 | 4,149.2 | 3,895.7 | 4,031.2 | 4,767.0 | 4,110.4 | 4,119.5 | 6,766.5 |
| 1996 | 4,320.7 | 4,638.5 | 4,739.1 | 4,562.6 | 4,258.7 | 3,846.5 | 3,901.5 | 4,722.9 | 4,338.4 | 3,456.6 | 3,299.9 | 4,103.7 |
| 1997 | 5,040.7 | 4,164.7 | 3,493.3 | 3,370.4 | 2,858.5 | 3,882.4 | 3,647.3 | 4,336.6 | 3,097.1 | 3,866.0 | 3,597.1 | 4,324.0 |
| 1998 | 5,041.7 | 5,042.0 | 5,262.5 | 6,573.3 | 7,202.3 | 8,490.8 | 6,663.9 | 6,170.3 | 5,712.7 | 5,364.9 | 5,206.2 | 4,177.8 |
| 1999 | 4,869.6 | 5,314.1 | 2,569.0 | 4,834.2 | 2,546.1 | 3,133.4 | 4,478.8 | 2,311.3 | 3,835.2 | 5,136.8 | 2,576.7 | 3,484.6 |
| 2000 | 3,892.9 | 4,573.2 | 4,499.5 | 5,780.2 | 4,297.8 | 4,967.5 | 2,735.7 | 4,528.3 | 4,984.0 | 5,058.6 | 3,775.3 | 3,944.5 |
| 2001 | 3,788.9 | 3,988.7 | 4,555.6 | 3,014.2 | 3,716.1 | 3,815.3 | 4,362.8 | 2,992.5 | 1,723.8 | 3,474.3 | 3,213.1 | 3,354.6 |
| 2002 | 2,035.4 | 1,918.4 | 2,013.4 | 3,121.3 | 2,781.0 | 2,401.0 | 1,856.4 | 2,813.4 | 1,821.9 | 1,679.6 | 1,599.5 | 1,944.6 |
| 2003 | 2,123.9 | 1,425.3 | 2,045.6 | 1,387.4 | 2,769.0 | 1,882.2 | 1,223.3 | 2,247.0 | 2,452.6 | 1,528.2 | 1,530.5 | 2,251.6 |
| 2004 | 1,352.4 | 1,399.1 | 1,577.0 | 2,038.7 | 1,811.2 | 1,066.5 | 1,591.5 | 1,686.8 | 1,472.9 | 1,123.3 | 2,049.5 | 2,741.8 |
| 2005 | NA | NA | NA | 1,152.5 | 1,795.2 | 2,816.0 | 1,334.9 | 685.2 | 609.5 | 399.6 | 334.0 | 974.0 |
| 2006 | 427.6 | 307.7 | 972.1 | 859.6 | 526.7 | 1,927.7 | 1,472.9 | 967.9 | 1,282.8 | 1,495.5 | 1,164.9 | 985.9 |
| 2007 | 911.2 | 1,047.4 | 1,270.1 | 1,504.9 | 1,487.9 | 1,770.6 | 1,623.7 | 2,794.8 | 1,481.8 | 1,973.1 | 1,515.8 | 1,949.9 |
| 2008 | 1,750.1 | 1,681.4 | 2,368.0 | 1,804.7 | 2,887.1 | 3,940.4 | 2,065.5 | 1,579.2 | 1,940.0 | 3,496.0 | 1,770.1 | 2,097.7 |
| 2009 | 2,222.6 | 1,681.8 | 2,704.9 | 2,024.1 | 3,036.6 | 3,294.6 | 3,345.5 | 3,286.0 | 3,027.1 | 4,357.0 | 3,287.3 | 3,643.2 |
| 2010 | 3,037.5 | 4,122.3 | 3,235.1 | 2,926.4 | 4,460.0 | 3,638.2 | 3,746.3 | 4,223.3 | 4,552.2 | 4,003.1 | 4,062.8 | 3,307.0 |
| 2011 | 4,196.9 | 4,686.8 | 4,873.1 | 4,537.3 | 4,350.9 | 4,501.8 | 4,570.0 | 3,033.5 | 4,979.8 | 4,101.0 | 5,025.8 | 3,537.6 |
| 2012 | 3,140.2 | NA | 2,163.4 | 3,882.2 | 4,220.3 | 3,254.7 | 3,585.5 | 3,008.5 | 3,417.5 | 3,472.0 | 3,508.9 | 3,540.4 |
| 2013 | 2,886.9 | 4,013.4 | 5,343.9 | 4,874.5 | 3,665.0 | 3,923.1 | 3,997.0 | 3,998.8 | 3,031.4 | 2,093.4 | 3,052.0 | 4,260.3 |
| 2014 | 4,423.5 | 4,376.0 | 3,557.5 | 4,201.2 | 2,152.2 | 2,618.6 | 2,558.1 | 2,736.3 | 3,121.8 | 4,404.5 | 3,615.0 | 4,190.5 |
| 2015 | 3,804.0 | 4,386.0 | 4,020.7 | 4,539.8 | 4,237.2 | 4,471.2 | 4,700.7 | 4,759.7 | 4,590.8 | 4,427.0 | 4,563.5 | 4,131.9 |
| 2016 | 4,792.6 | 5,359.0 | 4,667.0 | 5,401.0 | 6,859.3 | 5,732.5 | 5,262.4 | 5,109.1 | 4,384.8 | 3,977.7 | 4,424.4 | 3,872.1 |
| 2017 | 2,978.5 | 3,275.4 | 4,086.2 | 4,097.0 | 3,393.9 | 4,185.9 | 2,704.5 | 4,193.2 | 3,404.2 | 4,860.6 | 3,808.8 | 5,372.3 |
| 2018 | 5,035.4 | 3,988.8 | 4,243.3 | 3,704.6 | 4,815.2 | 4,565.6 | 3,578.4 | 4,605.6 | 4,375.7 | 3,440.7 | 3,561.3 | 3,217.5 |
| 2019 | 3,521.3 | 3,139.5 | 2,410.6 | 3,499.7 | 3,569.3 | 3,782.4 | 2,981.7 | 3,247.7 | 2,655.1 | 2,962.8 | 2,940.3 | 1,566.0 |
| 2020 | 2,117.6 | 3,823.1 | 3,319.5 | 4,358.4 | 2,385.5 | 3,344.0 | 1,973.8 | 1,834.3 | 2,021.1 | 2,314.2 | 2,590.0 | 2,258.8 |
| 2021 | 1,876.0 | 1,631.3 | 2,434.6 | 1,440.5 | 1,698.0 | 2,230.7 | 1,599.2 | 1,882.8 | 1,800.8 | 2,025.5 | 2,206.1 | 2,222.3 |
| 2022 | 2,281.9 | 2,514.3 | 2,547.9 | |||||||||
| - = No Data Reported; -- = Not Applicable; NA = Not Available; W = Withheld to avoid disclosure of individual company data. |
| Release Date: 6/1/2022 |
| Next Release Date: TBD |