|
Download Data (XLS File) |
|
||||||||
|
||||||||
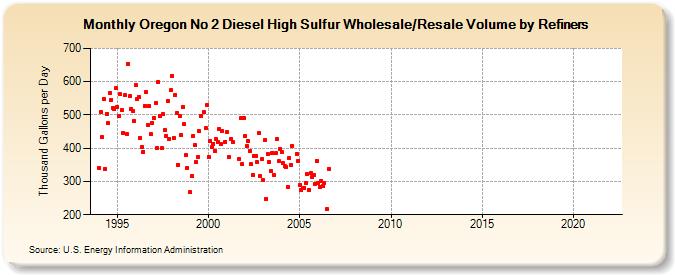
| Oregon No 2 Diesel High Sulfur Wholesale/Resale Volume by Refiners (Thousand Gallons per Day) | ||||||||
| Year | Jan | Feb | Mar | Apr | May | Jun | Jul | Aug | Sep | Oct | Nov | Dec |
|---|---|---|---|---|---|---|---|---|---|---|---|---|
| 1994 | 340.6 | 510.2 | 432.6 | 547.4 | 338.2 | 503.7 | 475.3 | 566.1 | 545.4 | 521.2 | 518.8 | 580.0 |
| 1995 | 523.4 | 496.8 | 561.8 | 514.7 | 446.9 | 559.1 | 443.4 | 653.9 | 555.7 | 518.8 | 512.1 | 482.6 |
| 1996 | 589.5 | 549.3 | 554.2 | 431.7 | 403.8 | 389.9 | 528.2 | 567.8 | 469.9 | 526.8 | 441.3 | 475.7 |
| 1997 | 491.6 | 535.0 | 400.1 | 599.4 | 495.5 | 399.4 | 501.7 | 454.2 | 437.1 | 542.7 | 429.1 | 573.8 |
| 1998 | 618.2 | 432.1 | 561.0 | 506.4 | 350.3 | 495.4 | 439.8 | 524.5 | 471.4 | 379.4 | 341.9 | W |
| 1999 | 267.9 | 315.8 | 437.9 | 409.0 | 357.3 | 373.8 | 450.3 | 495.9 | W | 507.7 | 459.6 | 530.1 |
| 2000 | 373.9 | 422.4 | 403.1 | 414.0 | 391.0 | 426.5 | 418.4 | 457.4 | 411.7 | 451.0 | W | 419.7 |
| 2001 | 447.9 | 374.1 | W | 427.8 | 417.5 | W | W | W | 367.7 | 490.2 | 351.8 | 491.0 |
| 2002 | 436.5 | 406.1 | 420.5 | 390.8 | 351.2 | 319.5 | 377.5 | 377.7 | 357.1 | 445.0 | 315.7 | 366.1 |
| 2003 | 303.0 | 423.4 | 248.7 | 382.1 | 358.4 | 330.4 | 385.6 | 319.7 | 384.5 | 428.4 | 360.2 | 398.4 |
| 2004 | 389.7 | 354.0 | 347.1 | 342.8 | 283.8 | 369.3 | 350.5 | 406.0 | NA | NA | 384.0 | 362.3 |
| 2005 | 289.6 | 272.8 | 280.3 | 281.4 | 296.4 | 321.4 | 275.5 | 324.0 | 313.7 | 319.5 | 293.7 | 362.3 |
| 2006 | 295.1 | 284.1 | 301.6 | 286.6 | 295.6 | NA | 216.5 | 338.9 | W | W | W | W |
| 2007 | W | W | W | W | W | W | W | W | W | - | - | - |
| 2008 | - | - | - | - | - | - | - | - | - | - | - | - |
| 2009 | - | - | - | - | - | - | - | - | - | - | - | - |
| 2010 | - | W | W | W | W | W | W | W | - | W | W | - |
| 2011 | W | W | W | - | W | - | - | - | - | W | - | - |
| 2012 | - | - | - | - | - | - | - | - | - | - | - | - |
| 2013 | - | - | - | - | - | - | - | - | - | - | - | - |
| 2014 | - | - | - | - | - | - | - | - | - | - | - | - |
| 2015 | - | - | - | - | - | - | - | - | - | - | - | - |
| 2016 | - | - | - | - | - | - | - | - | - | - | - | - |
| 2017 | - | - | - | - | - | - | - | - | - | - | - | - |
| 2018 | - | - | - | - | - | - | - | - | - | - | - | - |
| 2019 | - | - | - | - | - | - | - | - | - | - | - | - |
| 2020 | - | - | - | - | - | - | - | - | - | - | - | - |
| 2021 | - | - | - | - | - | - | - | - | - | - | - | - |
| 2022 | - | - | - | |||||||||
| - = No Data Reported; -- = Not Applicable; NA = Not Available; W = Withheld to avoid disclosure of individual company data. |
| Release Date: 6/1/2022 |
| Next Release Date: TBD |