|
Download Data (XLS File) |
|
||||||||
|
||||||||
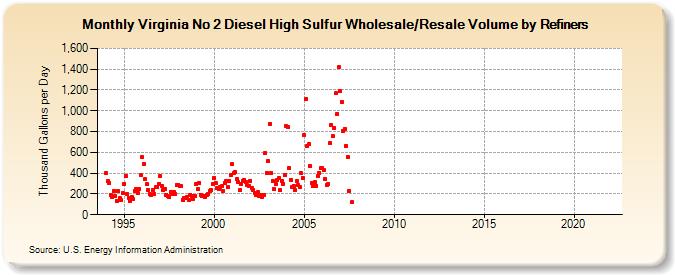
| Virginia No 2 Diesel High Sulfur Wholesale/Resale Volume by Refiners (Thousand Gallons per Day) | ||||||||
| Year | Jan | Feb | Mar | Apr | May | Jun | Jul | Aug | Sep | Oct | Nov | Dec |
|---|---|---|---|---|---|---|---|---|---|---|---|---|
| 1994 | 398.0 | 322.0 | 309.7 | 191.8 | 169.8 | 229.4 | 182.1 | 136.2 | 226.7 | 162.1 | 139.9 | 204.8 |
| 1995 | 296.4 | 374.2 | 195.5 | 160.9 | 136.4 | 174.5 | 151.6 | 228.0 | 246.1 | 206.3 | 247.3 | 378.0 |
| 1996 | 554.9 | 490.1 | 344.0 | 291.0 | 241.7 | 203.7 | 194.0 | 236.1 | 203.2 | 263.6 | 265.2 | 299.6 |
| 1997 | 369.5 | 277.5 | 239.4 | 250.5 | 193.4 | 179.1 | 169.0 | 219.5 | 199.2 | 221.6 | 200.9 | 288.4 |
| 1998 | 288.3 | 271.8 | 272.2 | 145.3 | 160.0 | 165.4 | 174.7 | 144.5 | 193.6 | 181.1 | 155.8 | 178.6 |
| 1999 | 298.3 | 243.2 | 305.7 | 194.4 | 175.6 | 184.3 | 169.8 | 192.3 | 202.6 | 226.4 | 240.1 | 291.4 |
| 2000 | 353.3 | 306.9 | 255.1 | 250.6 | 261.8 | 271.8 | 230.8 | 306.1 | 324.0 | 268.8 | 326.3 | 381.5 |
| 2001 | 484.1 | 398.4 | 412.6 | 340.0 | 312.4 | 236.7 | 298.2 | 327.0 | 338.5 | 315.4 | 282.0 | 280.0 |
| 2002 | 327.2 | 255.1 | 238.1 | 213.1 | 189.3 | 214.0 | 183.3 | 187.6 | 173.7 | 191.1 | 596.2 | 404.3 |
| 2003 | 521.4 | 876.9 | 398.2 | 325.1 | 248.2 | 297.7 | 335.6 | 350.8 | 238.5 | 325.9 | 295.8 | 383.7 |
| 2004 | 848.7 | 845.1 | 447.7 | 336.6 | 262.2 | 277.9 | 237.6 | 322.8 | 288.6 | 265.1 | 396.5 | 354.9 |
| 2005 | 765.5 | 1,110.0 | 658.7 | 676.2 | 465.7 | 306.8 | 278.3 | 313.4 | 278.2 | 374.6 | 405.7 | 444.8 |
| 2006 | 444.8 | 431.4 | 346.5 | 284.6 | 293.8 | 685.4 | 863.2 | 756.3 | 838.1 | 1,166.8 | 970.2 | 1,418.3 |
| 2007 | 1,188.6 | 1,085.4 | 808.1 | 828.7 | 663.6 | 559.1 | 228.7 | W | 120.7 | W | W | - |
| 2008 | - | - | - | - | - | - | - | - | - | W | W | W |
| 2009 | W | - | W | W | W | W | W | W | W | W | W | W |
| 2010 | W | W | W | W | W | W | W | W | W | W | W | W |
| 2011 | W | W | W | W | - | - | W | W | W | W | W | - |
| 2012 | - | - | - | W | - | - | - | - | - | - | - | - |
| 2013 | - | - | - | - | - | - | - | - | - | - | - | - |
| 2014 | - | - | - | - | - | - | - | - | - | - | - | - |
| 2015 | - | - | - | - | - | - | - | - | - | - | - | - |
| 2016 | - | - | - | - | - | - | - | - | - | - | - | - |
| 2017 | - | - | - | - | - | - | - | - | - | - | - | - |
| 2018 | - | - | - | - | - | - | - | - | - | - | - | - |
| 2019 | - | - | - | - | - | - | - | - | - | - | - | - |
| 2020 | - | - | - | - | - | - | - | - | - | - | - | - |
| 2021 | - | - | - | - | - | - | - | - | - | - | - | - |
| 2022 | - | - | - | |||||||||
| - = No Data Reported; -- = Not Applicable; NA = Not Available; W = Withheld to avoid disclosure of individual company data. |
| Release Date: 6/1/2022 |
| Next Release Date: TBD |