|
Download Data (XLS File) |
|
||||||||
|
||||||||
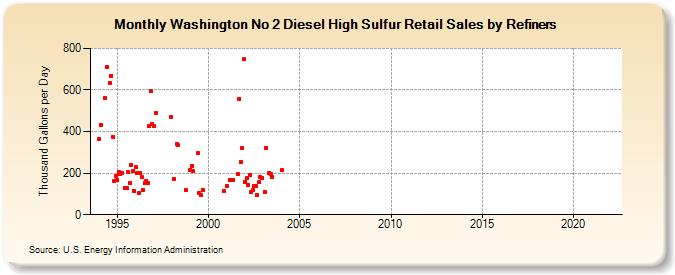
| Washington No 2 Diesel High Sulfur Retail Sales by Refiners (Thousand Gallons per Day) | ||||||||
| Year | Jan | Feb | Mar | Apr | May | Jun | Jul | Aug | Sep | Oct | Nov | Dec |
|---|---|---|---|---|---|---|---|---|---|---|---|---|
| 1994 | 363.6 | 433.5 | W | W | 559.0 | 712.8 | W | 634.0 | 669.1 | 373.9 | 159.8 | 186.7 |
| 1995 | 167.4 | 207.8 | 196.0 | 202.9 | W | 129.0 | 129.2 | 206.5 | 153.9 | 239.5 | 208.8 | 112.5 |
| 1996 | 228.5 | 199.1 | 102.4 | 199.5 | 183.0 | 118.8 | 151.2 | 164.4 | 150.7 | 427.1 | 593.0 | 436.9 |
| 1997 | 427.0 | 487.5 | W | W | W | W | W | W | W | W | W | 470.2 |
| 1998 | W | 173.6 | NA | 340.3 | 333.4 | W | W | W | W | 116.9 | W | W |
| 1999 | 217.0 | 236.5 | 209.7 | W | W | 295.3 | 102.1 | 93.0 | 120.2 | W | W | W |
| 2000 | W | W | W | W | W | W | W | W | W | W | 112.7 | W |
| 2001 | 140.4 | W | 167.1 | W | 165.3 | W | W | 194.6 | 558.0 | 254.2 | 318.6 | 747.1 |
| 2002 | 159.5 | 175.6 | 143.0 | 191.6 | 107.6 | 117.5 | 137.5 | 136.0 | 97.2 | 155.6 | 182.2 | 177.0 |
| 2003 | W | 108.1 | 321.2 | W | 201.7 | 194.9 | 180.6 | W | W | W | W | W |
| 2004 | 214.3 | W | W | W | W | W | W | W | W | NA | W | W |
| 2005 | W | W | W | W | W | W | W | W | W | W | W | W |
| 2006 | W | W | W | W | W | W | W | W | W | W | W | W |
| 2007 | W | W | W | W | W | W | W | W | W | W | W | W |
| 2008 | - | W | W | NA | W | W | W | W | W | W | NA | W |
| 2009 | W | W | NA | W | W | W | W | W | W | W | W | W |
| 2010 | W | - | - | - | - | - | - | - | - | - | - | - |
| 2011 | W | - | - | - | - | - | - | - | - | W | W | W |
| 2012 | W | W | - | - | W | - | W | - | - | W | - | - |
| 2013 | - | - | - | - | - | - | - | - | - | - | - | - |
| 2014 | - | - | - | - | - | - | - | - | - | - | - | - |
| 2015 | - | - | - | - | - | - | - | - | - | - | - | - |
| 2016 | - | - | - | - | - | - | - | - | - | - | - | - |
| 2017 | - | - | - | - | - | - | - | - | - | - | - | - |
| 2018 | - | - | - | - | - | - | - | - | - | - | - | - |
| 2019 | - | W | - | - | - | W | - | W | - | W | - | W |
| 2020 | W | W | - | W | W | W | W | W | - | - | - | - |
| 2021 | - | - | - | - | - | - | - | - | - | - | - | - |
| 2022 | - | - | - | |||||||||
| - = No Data Reported; -- = Not Applicable; NA = Not Available; W = Withheld to avoid disclosure of individual company data. |
| Release Date: 6/1/2022 |
| Next Release Date: TBD |