|
Download Data (XLS File) |
|
||||||||
|
||||||||
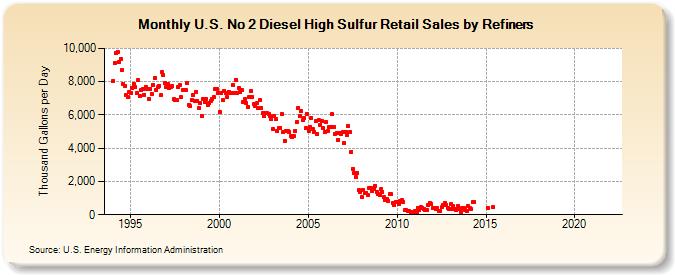
| U.S. No 2 Diesel High Sulfur Retail Sales by Refiners (Thousand Gallons per Day) | ||||||||
| Year | Jan | Feb | Mar | Apr | May | Jun | Jul | Aug | Sep | Oct | Nov | Dec |
|---|---|---|---|---|---|---|---|---|---|---|---|---|
| 1994 | 8,045.7 | 9,094.1 | 9,701.0 | 9,809.1 | 9,185.2 | 9,381.6 | 8,712.8 | 7,863.0 | 7,748.1 | 7,201.3 | 7,067.9 | 7,365.3 |
| 1995 | 7,337.6 | 7,592.0 | 7,859.5 | 7,667.9 | 7,309.6 | 8,073.1 | 7,148.4 | 7,486.9 | 7,547.1 | 7,217.1 | 7,706.0 | 7,550.1 |
| 1996 | 6,969.6 | 7,587.7 | 7,259.4 | 7,822.9 | 8,223.8 | 7,514.6 | 7,668.4 | 7,760.5 | 7,172.2 | 8,567.2 | 8,392.5 | 7,908.9 |
| 1997 | 7,665.4 | 7,857.1 | 7,596.5 | 7,693.0 | 7,723.5 | 6,929.0 | 6,873.3 | 6,897.0 | 7,681.8 | 7,779.1 | 7,048.0 | 7,513.1 |
| 1998 | 7,502.1 | 7,500.4 | 7,918.7 | 6,625.7 | 6,518.4 | 6,878.0 | 7,201.1 | 6,856.5 | 7,393.8 | 6,839.2 | 6,413.3 | 6,710.8 |
| 1999 | 5,961.8 | 6,941.2 | 6,754.6 | 6,945.7 | 6,624.4 | 6,693.1 | 6,856.0 | 6,954.9 | 7,070.9 | 7,538.7 | 7,580.3 | 7,329.7 |
| 2000 | 6,197.5 | 7,311.4 | 6,875.8 | 7,466.5 | 7,289.3 | 7,068.2 | 7,403.0 | 7,339.0 | 7,296.1 | 7,798.6 | 7,326.3 | 8,126.7 |
| 2001 | 7,288.6 | 7,614.8 | 7,368.4 | 7,488.9 | 6,780.0 | 6,938.5 | 6,688.9 | 6,497.8 | 7,067.3 | 7,438.0 | 7,100.5 | 6,654.0 |
| 2002 | 6,523.6 | 6,688.5 | 6,399.5 | 6,896.2 | 6,430.1 | 6,088.0 | 5,936.1 | 6,126.1 | 6,120.4 | 6,067.3 | 5,939.8 | 5,737.2 |
| 2003 | 5,146.1 | 5,964.4 | 5,741.5 | 5,059.8 | 5,219.2 | 5,226.0 | 6,042.5 | 4,989.9 | 4,450.9 | 5,031.9 | 5,057.4 | 4,994.4 |
| 2004 | 4,703.2 | 4,665.6 | 4,737.9 | 5,056.4 | 5,572.8 | 6,389.6 | 5,912.6 | 6,218.2 | 5,665.5 | 5,807.5 | 5,192.8 | 6,027.4 |
| 2005 | 5,056.3 | 5,301.4 | 5,836.4 | 5,126.5 | 4,991.5 | 5,614.3 | 4,838.8 | 5,664.8 | 5,411.7 | 5,616.3 | 5,185.4 | 4,963.6 |
| 2006 | 5,562.0 | 5,038.4 | 5,289.4 | 5,274.4 | 6,054.0 | 5,290.1 | 4,880.8 | 4,926.9 | 4,504.4 | 4,911.2 | 4,860.3 | 4,967.4 |
| 2007 | 4,301.7 | 5,002.9 | 4,817.1 | 5,348.1 | 4,962.8 | 3,799.8 | 2,768.0 | 2,525.9 | 2,256.3 | 2,535.7 | 1,462.3 | 1,381.5 |
| 2008 | 1,055.8 | 1,480.0 | 1,323.4 | 1,331.0 | 1,187.1 | 1,586.7 | 1,618.9 | 1,422.2 | 1,528.8 | 1,747.2 | 1,344.1 | 1,227.6 |
| 2009 | 1,198.3 | 1,521.6 | 1,376.8 | 1,052.7 | 879.2 | 949.7 | 826.0 | 1,245.0 | 1,224.2 | 709.2 | 606.9 | 788.5 |
| 2010 | 752.9 | 672.2 | 819.2 | 866.7 | 764.2 | 257.0 | 282.8 | 234.6 | 223.6 | 165.6 | 167.4 | 192.4 |
| 2011 | 201.8 | 157.8 | 427.4 | 259.4 | 439.0 | 419.9 | 368.8 | 286.3 | 307.0 | 559.6 | 718.8 | 657.9 |
| 2012 | 386.1 | 406.2 | 363.7 | 376.6 | 215.2 | 247.7 | 443.0 | 583.1 | 733.8 | 578.5 | 432.6 | 364.4 |
| 2013 | 621.5 | 360.5 | 515.4 | 329.1 | 265.4 | 532.2 | 341.1 | 189.4 | 429.4 | 429.5 | 285.5 | 196.1 |
| 2014 | 510.5 | 375.0 | 345.8 | 773.0 | 781.0 | W | W | W | W | W | W | W |
| 2015 | W | 399.8 | W | W | NA | 453.0 | W | W | W | W | W | W |
| 2016 | W | W | W | W | W | W | W | W | W | W | W | W |
| 2017 | W | W | W | W | W | W | W | W | W | W | W | W |
| 2018 | W | W | W | W | W | W | W | W | W | W | W | W |
| 2019 | W | W | W | W | W | W | W | W | W | W | W | W |
| 2020 | W | W | W | W | W | W | W | W | W | W | W | W |
| 2021 | W | W | W | W | W | W | W | W | W | W | W | W |
| 2022 | W | NA | NA | |||||||||
| - = No Data Reported; -- = Not Applicable; NA = Not Available; W = Withheld to avoid disclosure of individual company data. |
| Release Date: 6/1/2022 |
| Next Release Date: TBD |