|
Download Data (XLS File) |
|
||||||||
|
||||||||
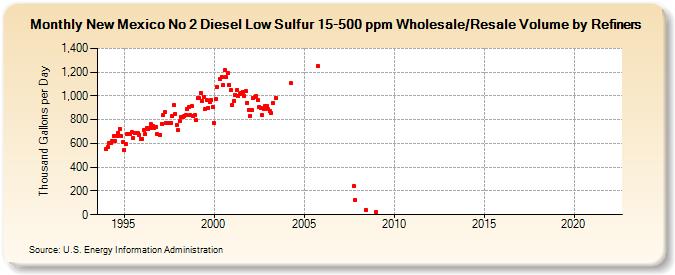
| New Mexico No 2 Diesel Low Sulfur 15-500 ppm Wholesale/Resale Volume by Refiners (Thousand Gallons per Day) | ||||||||
| Year | Jan | Feb | Mar | Apr | May | Jun | Jul | Aug | Sep | Oct | Nov | Dec |
|---|---|---|---|---|---|---|---|---|---|---|---|---|
| 1994 | 552.6 | 567.6 | 604.2 | 604.4 | 617.5 | 665.3 | 622.1 | 660.4 | 688.7 | 724.5 | 666.5 | 607.9 |
| 1995 | 545.7 | 596.7 | 675.6 | 683.3 | 683.5 | 694.4 | 645.5 | 689.4 | 685.2 | 691.6 | 672.2 | 640.5 |
| 1996 | 635.8 | 711.0 | 676.6 | 727.7 | 720.5 | 727.7 | 759.6 | 744.3 | 731.6 | 740.8 | 675.3 | W |
| 1997 | 672.3 | 767.5 | 835.8 | 861.9 | 768.6 | 774.3 | 775.6 | 774.4 | 833.6 | 920.3 | 851.6 | 756.4 |
| 1998 | 712.9 | 789.9 | 822.6 | 824.0 | 829.1 | 836.7 | 889.1 | 904.8 | 835.2 | 911.2 | 833.4 | 839.3 |
| 1999 | 795.1 | 982.0 | 984.1 | 1,027.5 | 955.9 | 992.1 | 886.6 | 962.5 | 899.9 | 947.1 | 966.6 | 908.1 |
| 2000 | 771.6 | 971.1 | 1,075.9 | W | 1,139.0 | 1,161.2 | 1,091.7 | 1,216.0 | 1,155.8 | 1,188.8 | 1,088.4 | 1,045.8 |
| 2001 | 925.2 | 955.5 | 1,010.3 | 1,045.7 | 995.7 | 1,018.9 | 1,022.4 | 1,035.3 | 1,002.3 | 1,037.5 | 944.5 | 883.9 |
| 2002 | 834.2 | 878.4 | 983.8 | 988.6 | 999.2 | 964.0 | 910.4 | 898.4 | 840.2 | 888.2 | 915.0 | 911.4 |
| 2003 | 888.9 | 874.3 | 855.1 | 943.5 | W | 985.5 | W | W | W | W | W | W |
| 2004 | W | W | W | 1,105.5 | W | W | W | W | W | W | W | W |
| 2005 | W | W | W | W | W | W | W | W | W | 1,252.2 | W | W |
| 2006 | W | W | W | W | W | W | W | W | W | W | W | W |
| 2007 | W | W | W | W | W | W | W | W | W | 238.5 | 126.2 | W |
| 2008 | W | W | W | W | W | 36.7 | W | W | W | W | W | W |
| 2009 | 24.2 | W | W | W | W | W | W | W | W | W | W | - |
| 2010 | - | W | W | W | - | - | - | - | - | - | - | - |
| 2011 | - | - | - | - | - | - | - | - | - | - | - | - |
| 2012 | - | - | - | - | - | - | - | - | - | - | - | - |
| 2013 | - | - | - | - | - | - | - | - | - | - | - | - |
| 2014 | - | - | - | - | - | - | - | - | - | - | - | - |
| 2015 | - | - | - | - | - | - | - | - | - | - | - | - |
| 2016 | - | - | - | - | - | - | - | - | - | - | - | - |
| 2017 | - | - | - | - | - | - | - | - | - | - | - | - |
| 2018 | - | - | - | - | - | - | - | - | - | - | - | - |
| 2019 | - | - | - | - | - | - | - | - | - | - | - | - |
| 2020 | - | - | - | - | - | - | - | - | - | - | - | - |
| 2021 | - | - | - | - | - | - | - | - | - | - | - | - |
| 2022 | - | - | - | |||||||||
| - = No Data Reported; -- = Not Applicable; NA = Not Available; W = Withheld to avoid disclosure of individual company data. |
| Release Date: 6/1/2022 |
| Next Release Date: TBD |