|
Download Data (XLS File) |
|
||||||||
|
||||||||
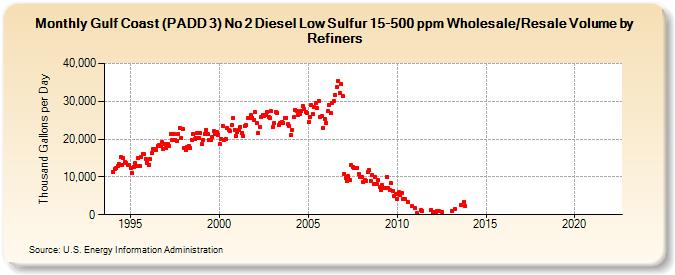
| Gulf Coast (PADD 3) No 2 Diesel Low Sulfur 15-500 ppm Wholesale/Resale Volume by Refiners (Thousand Gallons per Day) | ||||||||
| Year | Jan | Feb | Mar | Apr | May | Jun | Jul | Aug | Sep | Oct | Nov | Dec |
|---|---|---|---|---|---|---|---|---|---|---|---|---|
| 1994 | 11,365.8 | 12,137.6 | 12,227.4 | 12,834.8 | 13,407.2 | 15,250.1 | 13,169.0 | 14,934.3 | 14,029.5 | 13,739.2 | 13,066.6 | 13,031.1 |
| 1995 | 12,266.7 | 11,070.5 | 12,508.7 | 13,679.9 | 12,981.5 | 14,871.9 | 12,960.7 | 15,214.7 | 16,062.2 | 15,962.4 | 14,782.3 | 13,783.6 |
| 1996 | 13,183.9 | 14,703.3 | 16,242.0 | 17,438.8 | 17,481.1 | 17,131.3 | 18,135.4 | 18,432.4 | 18,160.1 | 19,183.1 | 17,465.0 | 18,634.1 |
| 1997 | 17,562.2 | 18,598.3 | 18,125.5 | 21,425.7 | 19,855.2 | 21,431.6 | 19,873.2 | 19,381.3 | 21,384.0 | 22,926.9 | 20,304.1 | 22,731.6 |
| 1998 | 17,693.1 | 17,032.7 | 17,933.5 | 18,156.2 | 17,650.4 | 19,824.9 | 21,225.5 | 19,902.1 | 20,414.6 | 21,545.8 | 20,285.6 | 21,703.2 |
| 1999 | 18,666.1 | 19,882.1 | 21,380.5 | 22,480.4 | 21,364.9 | 19,881.0 | 19,748.2 | 20,632.3 | 22,025.7 | 21,479.7 | 21,756.8 | 21,009.6 |
| 2000 | 18,595.0 | 20,137.8 | 23,593.7 | 19,889.1 | 19,911.8 | 22,952.1 | 22,489.3 | 22,054.2 | 23,768.8 | 25,591.6 | 22,433.7 | 20,865.8 |
| 2001 | 21,855.2 | 22,524.9 | 23,291.9 | 21,657.2 | 20,710.6 | 23,563.4 | 23,616.1 | 25,674.5 | 25,486.7 | 26,300.7 | 25,625.1 | 25,028.5 |
| 2002 | 27,164.7 | 24,183.1 | 21,542.4 | 23,268.6 | 25,756.9 | 26,355.2 | 26,179.2 | 26,428.3 | 27,165.9 | 25,969.4 | 25,698.2 | 27,330.5 |
| 2003 | 23,184.6 | 24,364.9 | 27,205.0 | 26,932.1 | 23,824.9 | 24,142.8 | 24,522.5 | 24,257.1 | 25,655.6 | 25,658.5 | 23,933.9 | 23,411.4 |
| 2004 | 21,103.5 | 22,481.9 | 25,716.0 | 27,717.8 | 27,450.0 | 26,427.4 | 26,592.0 | 27,347.3 | 28,785.8 | 28,054.9 | 27,079.9 | 26,888.3 |
| 2005 | 24,482.8 | 25,837.3 | 28,963.4 | 26,664.6 | 28,540.5 | 29,658.0 | 28,137.6 | 30,101.6 | 25,856.3 | 26,052.4 | 23,055.8 | 25,446.7 |
| 2006 | 24,256.6 | 27,345.0 | 28,973.3 | 26,826.2 | 29,481.5 | 30,136.2 | 31,536.3 | 33,658.2 | 35,429.6 | 32,234.6 | 34,567.9 | 31,407.0 |
| 2007 | 10,845.3 | 9,776.8 | 8,876.6 | 10,142.4 | 9,116.0 | 13,032.0 | 12,663.8 | 12,428.9 | 12,481.9 | 12,419.1 | 10,881.0 | 9,958.2 |
| 2008 | 10,001.4 | 8,643.0 | 9,292.4 | 9,002.3 | 11,206.7 | 11,879.4 | 8,999.8 | 10,470.1 | 8,118.5 | 10,011.8 | 8,001.9 | 9,182.0 |
| 2009 | 7,228.0 | 6,589.8 | 7,767.0 | 7,092.6 | 7,107.5 | 9,974.7 | 7,062.2 | 6,603.7 | 8,258.8 | 6,222.0 | 5,018.6 | 5,363.4 |
| 2010 | 4,242.4 | 5,901.7 | 5,280.2 | 5,695.2 | 4,160.0 | 4,076.1 | NA | 3,467.0 | W | W | 2,195.1 | W |
| 2011 | 1,799.5 | 351.0 | W | W | 1,148.8 | 921.8 | W | W | W | W | W | 1,340.3 |
| 2012 | 480.9 | 661.8 | 695.9 | 860.0 | 859.9 | W | 653.4 | W | W | W | W | W |
| 2013 | W | 1,002.8 | W | 1,477.2 | W | W | W | 2,566.4 | W | 3,439.6 | 2,255.1 | W |
| 2014 | W | W | W | W | W | W | W | W | W | W | W | W |
| 2015 | W | W | W | W | W | W | W | W | W | W | W | W |
| 2016 | W | W | W | W | W | W | W | W | W | W | W | W |
| 2017 | W | W | W | W | W | W | W | W | W | W | W | W |
| 2018 | W | W | W | W | W | W | W | W | W | W | - | - |
| 2019 | - | - | W | - | W | W | - | W | - | - | - | - |
| 2020 | - | W | W | W | - | - | - | - | - | - | - | - |
| 2021 | - | - | - | - | - | - | - | W | - | - | - | - |
| 2022 | - | - | - | |||||||||
| - = No Data Reported; -- = Not Applicable; NA = Not Available; W = Withheld to avoid disclosure of individual company data. |
| Release Date: 6/1/2022 |
| Next Release Date: TBD |