|
Download Data (XLS File) |
|
||||||||
|
||||||||
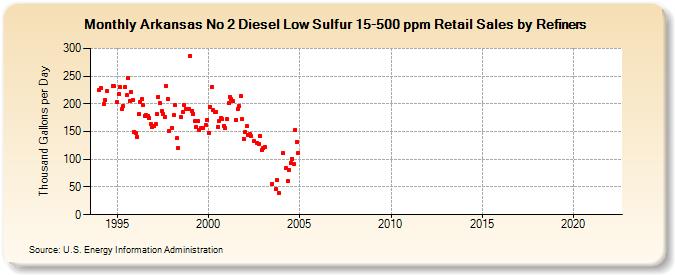
| Arkansas No 2 Diesel Low Sulfur 15-500 ppm Retail Sales by Refiners (Thousand Gallons per Day) | ||||||||
| Year | Jan | Feb | Mar | Apr | May | Jun | Jul | Aug | Sep | Oct | Nov | Dec |
|---|---|---|---|---|---|---|---|---|---|---|---|---|
| 1994 | 224.1 | 228.0 | W | 200.1 | 206.9 | 223.8 | W | W | W | 233.0 | 232.1 | W |
| 1995 | 202.5 | 217.1 | 230.6 | 190.2 | 195.9 | 231.2 | 215.2 | 245.8 | 204.8 | 221.4 | 207.2 | 149.9 |
| 1996 | 147.0 | 140.8 | 180.8 | 202.6 | 209.0 | 197.0 | 178.3 | 180.3 | 178.6 | 174.7 | 163.6 | 158.7 |
| 1997 | 159.5 | 162.9 | 181.2 | 213.1 | 201.0 | 186.5 | 182.1 | 176.4 | 233.0 | 208.7 | 151.6 | W |
| 1998 | 157.3 | 179.8 | 197.3 | 137.6 | 120.4 | W | 176.3 | 185.3 | 197.1 | 191.5 | 191.2 | 191.5 |
| 1999 | 286.6 | 187.8 | 182.1 | 168.7 | 158.7 | 168.7 | 152.2 | 156.0 | 156.0 | W | 161.7 | 171.3 |
| 2000 | 147.9 | 194.3 | 230.3 | 189.1 | 185.6 | 185.2 | 159.0 | 169.4 | 175.3 | 172.4 | 160.7 | 156.0 |
| 2001 | 171.8 | 200.7 | 213.2 | 208.4 | 204.3 | W | 171.6 | 190.9 | 195.2 | 213.9 | 172.7 | 136.4 |
| 2002 | 148.8 | 159.7 | 144.5 | 144.8 | 141.6 | W | 132.8 | W | 129.3 | 127.6 | 141.6 | 116.1 |
| 2003 | 120.7 | 122.9 | W | W | W | W | 55.6 | W | 45.7 | 63.0 | 39.3 | W |
| 2004 | W | 111.1 | W | 84.2 | 60.1 | 80.9 | 93.9 | 101.2 | 91.1 | 152.9 | 131.8 | 111.7 |
| 2005 | W | W | W | W | W | W | W | W | W | W | W | W |
| 2006 | W | W | W | W | W | W | W | W | W | W | W | W |
| 2007 | W | W | W | W | W | W | W | W | W | W | W | W |
| 2008 | W | W | W | W | W | W | W | W | W | W | W | W |
| 2009 | W | W | - | - | W | - | W | W | W | W | - | - |
| 2010 | W | W | - | - | - | - | - | - | - | - | - | - |
| 2011 | - | - | - | - | - | - | - | - | - | - | - | - |
| 2012 | - | - | - | - | - | - | - | - | - | - | - | - |
| 2013 | - | - | - | - | - | - | - | - | - | - | - | - |
| 2014 | - | - | - | - | - | - | - | - | - | - | - | - |
| 2015 | - | - | - | - | - | - | - | - | - | - | - | - |
| 2016 | - | - | - | - | - | - | - | - | - | - | - | - |
| 2017 | - | - | - | - | - | - | - | - | - | - | - | - |
| 2018 | - | - | - | - | - | - | - | - | - | - | - | - |
| 2019 | - | - | - | - | - | - | - | - | - | - | - | - |
| 2020 | - | - | - | - | - | - | - | - | - | - | - | - |
| 2021 | - | - | - | - | - | - | - | - | - | - | - | - |
| 2022 | - | - | - | |||||||||
| - = No Data Reported; -- = Not Applicable; NA = Not Available; W = Withheld to avoid disclosure of individual company data. |
| Release Date: 6/1/2022 |
| Next Release Date: TBD |