|
Download Data (XLS File) |
|
||||||||
|
||||||||
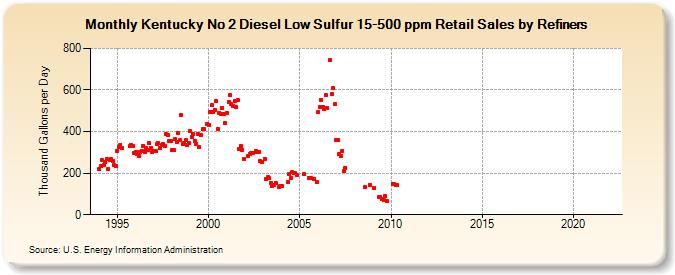
| Kentucky No 2 Diesel Low Sulfur 15-500 ppm Retail Sales by Refiners (Thousand Gallons per Day) | ||||||||
| Year | Jan | Feb | Mar | Apr | May | Jun | Jul | Aug | Sep | Oct | Nov | Dec |
|---|---|---|---|---|---|---|---|---|---|---|---|---|
| 1994 | 218.1 | 233.0 | 261.4 | 238.0 | 251.8 | 268.9 | 219.0 | 261.9 | 266.3 | 258.8 | 238.0 | 233.3 |
| 1995 | 307.9 | 323.6 | 336.6 | 321.2 | W | W | W | W | 328.3 | 336.4 | 331.8 | 297.0 |
| 1996 | 302.1 | 293.8 | 281.3 | 299.8 | 308.4 | 332.7 | 303.4 | 320.2 | 313.1 | 345.8 | 320.1 | 301.5 |
| 1997 | 306.7 | 307.9 | 340.2 | 344.0 | 323.0 | 336.4 | 341.7 | 331.6 | 387.0 | 381.2 | 354.0 | 356.3 |
| 1998 | 309.0 | 310.7 | 362.1 | 349.0 | 394.8 | 358.2 | 479.8 | 337.9 | 343.7 | 357.7 | 334.0 | 344.7 |
| 1999 | 401.5 | 373.1 | 385.9 | 355.6 | 342.5 | 386.8 | 323.9 | 382.3 | 410.4 | 410.3 | W | 437.7 |
| 2000 | 430.6 | 492.6 | 525.5 | 493.8 | 505.8 | 546.2 | 414.3 | 488.9 | 483.0 | 515.5 | 485.3 | 439.7 |
| 2001 | 491.1 | 542.2 | 574.4 | 532.1 | 524.4 | 547.7 | 518.6 | 551.3 | 314.4 | 330.5 | 312.7 | 265.8 |
| 2002 | W | W | 284.5 | 293.2 | 294.9 | 295.1 | W | 306.7 | 302.1 | 303.5 | 257.5 | 251.6 |
| 2003 | W | 269.2 | 173.9 | 181.3 | 174.5 | 152.8 | 137.8 | 145.2 | 152.3 | W | 134.1 | 139.0 |
| 2004 | 137.2 | W | W | W | 156.9 | 194.9 | 178.2 | 203.1 | 203.0 | 200.4 | 188.8 | W |
| 2005 | W | W | W | 194.4 | W | W | 176.9 | 175.5 | W | 172.3 | W | 157.0 |
| 2006 | 493.2 | 519.6 | 554.0 | 517.2 | 509.3 | 576.2 | 512.6 | W | 744.1 | 581.2 | 609.5 | 531.9 |
| 2007 | 357.3 | 358.0 | 289.9 | 282.4 | 307.5 | 210.0 | 226.4 | W | W | W | W | W |
| 2008 | W | W | W | W | W | W | W | 133.2 | W | W | 144.7 | W |
| 2009 | W | 128.6 | W | W | 85.1 | 85.5 | 73.7 | 70.3 | 88.3 | 67.7 | W | W |
| 2010 | W | 148.6 | 146.9 | 143.1 | 141.5 | W | W | W | W | W | W | W |
| 2011 | W | W | W | W | W | W | W | W | W | W | W | W |
| 2012 | W | W | W | W | W | W | W | W | W | W | W | W |
| 2013 | W | W | W | W | W | W | W | W | W | W | W | W |
| 2014 | W | W | W | W | W | - | - | - | - | - | - | - |
| 2015 | - | - | - | - | - | - | - | - | - | - | - | - |
| 2016 | - | - | - | - | - | - | - | - | - | - | - | - |
| 2017 | - | - | - | - | - | - | - | - | - | - | - | - |
| 2018 | - | - | - | - | - | - | - | - | - | - | - | - |
| 2019 | - | - | - | - | - | - | - | - | - | - | - | - |
| 2020 | - | - | - | - | - | - | - | - | - | - | - | - |
| 2021 | - | - | - | - | - | - | - | - | - | - | - | - |
| 2022 | - | - | - | |||||||||
| - = No Data Reported; -- = Not Applicable; NA = Not Available; W = Withheld to avoid disclosure of individual company data. |
| Release Date: 6/1/2022 |
| Next Release Date: TBD |