|
Download Data (XLS File) |
|
||||||||
|
||||||||
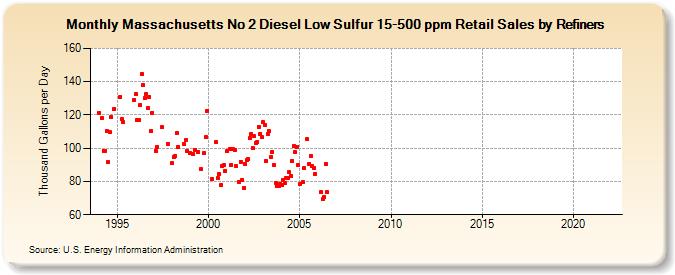
| Massachusetts No 2 Diesel Low Sulfur 15-500 ppm Retail Sales by Refiners (Thousand Gallons per Day) | ||||||||
| Year | Jan | Feb | Mar | Apr | May | Jun | Jul | Aug | Sep | Oct | Nov | Dec |
|---|---|---|---|---|---|---|---|---|---|---|---|---|
| 1994 | 121.4 | W | 118.3 | 98.6 | 98.4 | 110.4 | 91.5 | 109.5 | 118.7 | W | 123.8 | W |
| 1995 | W | W | 130.9 | 117.4 | 115.5 | W | W | W | W | W | W | 129.0 |
| 1996 | 132.3 | 117.1 | 117.2 | 126.0 | 144.9 | 137.9 | 130.2 | 132.3 | 124.1 | 130.8 | 110.3 | 121.3 |
| 1997 | W | 98.5 | 101.0 | W | W | 112.5 | W | W | W | 102.8 | W | W |
| 1998 | 90.9 | 94.4 | 95.3 | 108.9 | 100.8 | W | W | W | 102.4 | 104.8 | 98.3 | W |
| 1999 | 97.2 | W | 96.5 | 99.0 | W | 98.0 | W | 87.3 | W | 97.1 | 106.5 | 122.3 |
| 2000 | W | W | 81.5 | W | W | 103.5 | 82.2 | 84.5 | 77.6 | 89.1 | 89.7 | 86.4 |
| 2001 | 98.3 | W | 99.5 | 89.9 | 99.3 | 99.0 | 89.0 | W | 79.9 | 91.9 | 81.0 | 76.0 |
| 2002 | 90.5 | 92.7 | 93.2 | 105.9 | 108.4 | 100.3 | 107.1 | 103.0 | 103.8 | 112.8 | 108.7 | 106.5 |
| 2003 | 115.5 | 114.1 | 92.2 | 108.6 | 110.1 | 94.7 | 97.8 | 89.8 | 79.0 | 77.5 | 77.0 | 78.7 |
| 2004 | 77.6 | 81.0 | 79.3 | 82.3 | 81.8 | 85.4 | 83.4 | 92.3 | 101.4 | 97.7 | 100.9 | 89.8 |
| 2005 | 78.4 | W | 79.6 | 88.0 | W | 105.3 | 90.6 | 95.3 | 89.1 | 88.3 | 84.5 | W |
| 2006 | W | W | 73.4 | 69.3 | 70.7 | 90.6 | 73.5 | W | W | W | W | W |
| 2007 | W | W | W | W | W | W | W | W | W | W | W | W |
| 2008 | W | W | W | W | W | W | W | W | W | - | - | - |
| 2009 | - | - | - | - | - | - | - | W | - | - | - | - |
| 2010 | - | - | - | - | - | - | - | - | - | - | - | - |
| 2011 | - | - | - | - | - | - | - | - | - | - | - | - |
| 2012 | - | - | - | - | - | - | - | - | - | - | - | - |
| 2013 | - | - | - | - | - | - | - | - | - | - | - | - |
| 2014 | - | - | - | - | - | - | - | - | - | - | - | - |
| 2015 | - | - | - | - | - | - | - | - | - | - | - | - |
| 2016 | - | - | - | - | - | - | - | - | - | - | - | - |
| 2017 | - | - | - | - | - | - | - | - | - | - | - | - |
| 2018 | - | - | - | - | - | - | - | - | - | - | - | - |
| 2019 | - | - | - | - | - | - | - | - | - | - | - | - |
| 2020 | - | - | - | - | - | - | - | - | - | - | - | - |
| 2021 | - | - | - | - | - | - | - | - | - | - | - | - |
| 2022 | - | - | - | |||||||||
| - = No Data Reported; -- = Not Applicable; NA = Not Available; W = Withheld to avoid disclosure of individual company data. |
| Release Date: 6/1/2022 |
| Next Release Date: TBD |