|
Download Data (XLS File) |
|
||||||||
|
||||||||
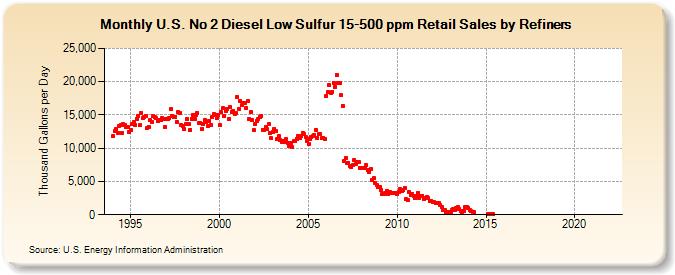
| U.S. No 2 Diesel Low Sulfur 15-500 ppm Retail Sales by Refiners (Thousand Gallons per Day) | ||||||||
| Year | Jan | Feb | Mar | Apr | May | Jun | Jul | Aug | Sep | Oct | Nov | Dec |
|---|---|---|---|---|---|---|---|---|---|---|---|---|
| 1994 | 11,803.6 | 12,515.8 | 12,835.2 | 12,326.5 | 13,365.8 | 13,482.6 | 12,252.9 | 13,592.8 | 13,434.9 | 13,160.9 | 13,132.8 | 12,410.7 |
| 1995 | 12,729.2 | 13,630.8 | 13,871.5 | 13,415.9 | 14,459.3 | 14,821.9 | 13,440.6 | 15,280.5 | 14,523.2 | 14,752.6 | 14,904.2 | 13,026.7 |
| 1996 | 13,186.1 | 14,178.5 | 13,984.4 | 14,794.4 | 14,713.9 | 14,485.1 | 14,024.2 | 14,302.4 | 14,181.5 | 14,487.4 | 14,453.5 | 13,241.6 |
| 1997 | 14,347.0 | 14,424.8 | 14,557.6 | 15,878.9 | 14,833.2 | 14,629.2 | 14,731.1 | 13,974.2 | 15,427.7 | 15,272.6 | 13,470.8 | 13,377.6 |
| 1998 | 12,872.2 | 13,595.6 | 14,329.2 | 13,698.8 | 12,807.6 | 14,457.1 | 15,026.9 | 14,427.2 | 15,010.9 | 15,318.4 | 13,796.6 | 13,794.8 |
| 1999 | 12,956.0 | 13,591.2 | 14,267.8 | 13,968.0 | 13,264.2 | 14,102.5 | 13,534.5 | 14,636.1 | 15,075.8 | 14,965.7 | 14,546.1 | 15,019.5 |
| 2000 | 13,458.7 | 15,390.3 | 15,973.6 | 14,824.1 | 15,622.4 | 15,906.3 | 14,324.8 | 16,160.8 | 15,453.0 | 15,662.2 | 15,191.4 | 15,240.4 |
| 2001 | 17,681.0 | 15,964.2 | 17,021.2 | 16,449.2 | 16,722.7 | 16,841.7 | 16,036.6 | 17,103.5 | 14,372.8 | 15,415.0 | 14,165.5 | 12,675.6 |
| 2002 | 13,643.9 | 14,139.8 | 14,331.2 | 14,751.7 | 14,777.1 | 12,805.4 | 12,734.0 | 13,117.6 | 12,843.3 | 13,570.0 | 12,293.3 | 11,486.1 |
| 2003 | 12,444.5 | 12,916.9 | 12,575.1 | 11,337.8 | 11,774.9 | 11,200.1 | 10,943.5 | 11,119.7 | 11,002.9 | 11,334.3 | 10,807.7 | 10,349.4 |
| 2004 | 10,722.5 | 10,169.3 | 11,006.9 | 11,055.8 | 11,453.3 | 11,789.3 | 11,471.5 | 11,901.0 | 12,245.7 | 12,066.7 | 11,643.2 | 11,097.5 |
| 2005 | 10,647.8 | 11,424.6 | 11,627.8 | 11,804.9 | 11,995.2 | 12,802.7 | 11,534.8 | 12,113.2 | 12,105.1 | 11,539.5 | 11,547.6 | 11,431.8 |
| 2006 | 17,876.5 | 18,432.9 | 19,509.2 | 18,359.4 | 18,498.7 | 19,820.0 | 19,232.4 | 21,005.4 | 19,749.6 | 19,827.5 | 17,966.3 | 16,401.0 |
| 2007 | 8,077.2 | 8,518.3 | 7,748.5 | 7,780.9 | 7,386.7 | 7,103.4 | 7,412.6 | 8,215.6 | 7,615.7 | 7,900.1 | 7,885.2 | 7,059.7 |
| 2008 | 6,989.5 | 6,990.4 | 7,002.8 | 7,412.4 | 6,790.4 | 6,462.0 | 6,799.7 | 5,216.6 | 5,465.1 | 4,800.0 | 4,447.5 | 4,125.0 |
| 2009 | 4,183.1 | 3,769.0 | 3,177.6 | 3,083.4 | 3,214.0 | 3,575.2 | 3,151.3 | 3,340.9 | 3,326.8 | 3,328.5 | 3,290.4 | 3,295.2 |
| 2010 | 3,055.4 | 3,366.7 | 3,793.5 | 3,548.4 | 3,662.0 | 4,042.4 | 2,298.7 | 2,184.4 | 3,413.5 | 2,987.7 | 3,129.1 | 2,813.9 |
| 2011 | 2,518.5 | 2,781.9 | 3,308.9 | 2,507.7 | 2,836.4 | 2,856.8 | 2,306.1 | 2,585.9 | 2,650.2 | 2,499.0 | 1,988.2 | 2,121.4 |
| 2012 | 1,887.5 | 1,866.5 | 1,744.5 | 1,745.8 | 1,735.2 | 1,386.3 | 1,162.9 | 753.7 | 657.0 | 436.5 | 471.0 | 406.6 |
| 2013 | 384.7 | 736.1 | 823.2 | 721.1 | 935.6 | 1,092.7 | 886.7 | 505.6 | 473.2 | 613.5 | 1,192.0 | 1,171.1 |
| 2014 | 1,042.9 | 635.9 | 484.9 | 475.7 | 347.7 | W | W | W | W | W | W | W |
| 2015 | W | 138.9 | W | 109.1 | 115.8 | 64.1 | W | W | W | W | W | W |
| 2016 | W | W | W | W | W | W | W | W | W | W | W | W |
| 2017 | W | W | W | W | W | W | W | W | W | W | W | W |
| 2018 | W | W | W | W | W | W | W | W | W | W | W | W |
| 2019 | W | W | W | W | W | W | W | W | W | W | W | W |
| 2020 | W | W | W | W | W | W | W | W | W | W | W | W |
| 2021 | - | - | - | - | - | - | W | - | - | - | - | - |
| 2022 | - | NA | NA | |||||||||
| - = No Data Reported; -- = Not Applicable; NA = Not Available; W = Withheld to avoid disclosure of individual company data. |
| Release Date: 6/1/2022 |
| Next Release Date: TBD |