|
Download Data (XLS File) |
|
||||||||
|
||||||||
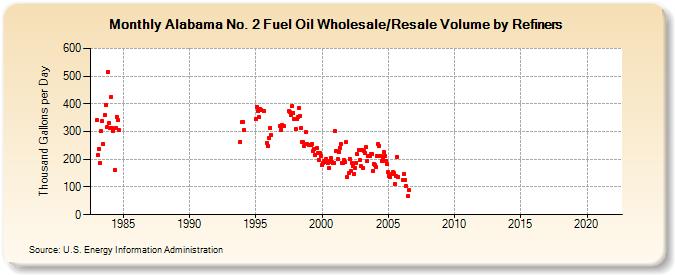
| Alabama No. 2 Fuel Oil Wholesale/Resale Volume by Refiners (Thousand Gallons per Day) | ||||||||
| Year | Jan | Feb | Mar | Apr | May | Jun | Jul | Aug | Sep | Oct | Nov | Dec |
|---|---|---|---|---|---|---|---|---|---|---|---|---|
| 1983 | 340.0 | 214.1 | 238.7 | 187.9 | 302.3 | 338.8 | 254.7 | 359.5 | 394.7 | 314.8 | 516.5 | 331.5 |
| 1984 | 314.5 | 425.6 | 313.1 | 303.6 | 162.6 | 311.4 | 353.7 | 340.9 | 305.3 | |||
| 1993 | W | 263.4 | 333.0 | |||||||||
| 1994 | 333.9 | 306.8 | W | W | W | W | W | W | W | W | W | W |
| 1995 | 343.8 | 390.3 | 374.8 | 352.4 | 381.0 | 379.0 | W | 373.6 | W | W | 258.3 | 247.5 |
| 1996 | 275.6 | 314.3 | 287.9 | W | W | W | W | W | W | W | 320.8 | 306.8 |
| 1997 | 323.2 | 318.6 | W | W | W | W | 373.4 | 369.5 | 360.7 | 390.4 | 368.1 | 343.9 |
| 1998 | 307.7 | 345.1 | 353.2 | 386.2 | 356.2 | 314.2 | 261.2 | 260.9 | 248.1 | 296.6 | 255.8 | W |
| 1999 | 250.6 | 253.2 | 251.3 | 255.3 | 228.4 | 235.5 | 213.9 | 239.8 | 222.0 | 198.6 | 222.7 | 211.1 |
| 2000 | 179.6 | 186.7 | 194.2 | 191.5 | 200.9 | 186.4 | 168.2 | 193.9 | 204.0 | 189.1 | 186.4 | 187.8 |
| 2001 | 301.0 | 230.3 | 199.6 | 225.8 | 242.2 | 254.5 | 187.2 | 186.5 | 195.8 | 189.8 | 260.9 | 135.7 |
| 2002 | 148.9 | 202.5 | 156.4 | 187.4 | 175.9 | 148.3 | 169.5 | 187.9 | 217.8 | 233.8 | 198.0 | 174.5 |
| 2003 | 234.9 | 170.3 | 229.7 | 222.8 | 244.7 | 194.8 | 210.7 | 213.1 | 218.0 | 220.5 | 157.2 | 184.3 |
| 2004 | 180.0 | 171.6 | 212.5 | 254.3 | 248.5 | 213.3 | 192.5 | 203.0 | 225.8 | 213.5 | 193.9 | 182.4 |
| 2005 | 152.9 | 140.2 | 134.5 | 145.6 | 152.4 | 151.1 | 110.8 | 140.3 | 210.0 | 137.2 | W | W |
| 2006 | W | 124.9 | 146.5 | 125.1 | 101.9 | W | 65.8 | 88.7 | W | W | W | W |
| 2007 | W | W | W | W | W | W | W | W | - | - | W | W |
| 2008 | W | W | W | W | W | W | W | W | W | W | W | W |
| 2009 | W | W | W | W | W | W | W | W | W | W | W | W |
| 2010 | W | W | - | - | - | - | - | - | - | - | - | - |
| 2011 | - | - | - | - | - | - | - | - | - | - | - | - |
| 2012 | - | - | - | - | - | - | - | - | - | - | - | - |
| 2013 | - | - | - | - | - | - | - | - | - | - | - | - |
| 2014 | - | - | - | - | - | - | - | - | - | - | - | - |
| 2015 | - | - | - | - | - | - | - | - | - | - | - | - |
| 2016 | - | - | - | - | - | - | - | - | - | - | - | - |
| 2017 | - | - | - | - | - | - | - | - | - | - | - | - |
| 2018 | - | - | - | - | - | - | - | - | - | - | - | - |
| 2019 | - | - | W | W | - | W | - | W | - | - | - | - |
| 2020 | - | - | - | - | - | - | - | - | - | - | W | - |
| 2021 | - | - | - | - | - | - | - | - | - | - | - | - |
| 2022 | - | - | - | |||||||||
| - = No Data Reported; -- = Not Applicable; NA = Not Available; W = Withheld to avoid disclosure of individual company data. |
| Release Date: 6/1/2022 |
| Next Release Date: TBD |