|
Download Data (XLS File) |
|
||||||||
|
||||||||
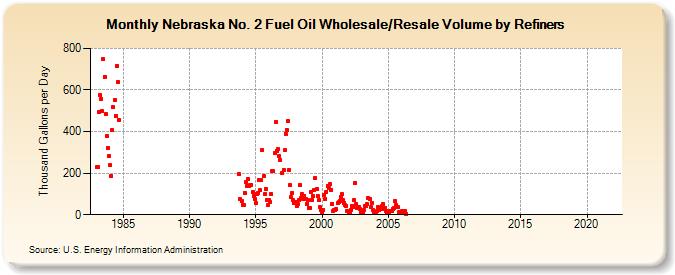
| Nebraska No. 2 Fuel Oil Wholesale/Resale Volume by Refiners (Thousand Gallons per Day) | ||||||||
| Year | Jan | Feb | Mar | Apr | May | Jun | Jul | Aug | Sep | Oct | Nov | Dec |
|---|---|---|---|---|---|---|---|---|---|---|---|---|
| 1983 | 227.6 | 229.2 | 493.5 | 576.7 | 558.2 | 497.3 | 746.9 | 664.3 | 485.5 | 377.9 | 321.3 | 281.5 |
| 1984 | 237.2 | 186.8 | 406.0 | 515.9 | 553.2 | 475.3 | 716.5 | 640.5 | 457.5 | |||
| 1993 | 194.5 | 73.8 | 64.1 | |||||||||
| 1994 | 47.6 | 44.9 | 103.4 | 155.8 | 136.9 | 172.9 | 137.5 | 141.0 | 145.3 | 109.7 | 89.6 | 75.4 |
| 1995 | 54.8 | 100.9 | 106.2 | 166.7 | 116.9 | 164.6 | 310.3 | 185.9 | 98.9 | 124.3 | 68.9 | 45.8 |
| 1996 | 71.7 | 60.4 | 99.5 | 211.8 | 208.4 | 296.8 | 447.8 | 308.6 | 314.2 | 281.7 | 263.1 | W |
| 1997 | 203.0 | 216.2 | 309.2 | 390.4 | 409.1 | 448.8 | 216.3 | 141.3 | 83.7 | 104.5 | 68.4 | 57.7 |
| 1998 | 59.2 | 41.1 | 50.1 | 68.7 | 142.9 | 81.0 | 98.0 | 73.5 | 92.4 | 76.4 | 50.6 | 68.4 |
| 1999 | 34.7 | 33.2 | 110.4 | 72.8 | 88.0 | 121.2 | 176.9 | 123.6 | 91.9 | 69.4 | 39.2 | 21.3 |
| 2000 | 15.4 | 24.1 | 96.1 | 76.9 | 110.7 | 138.3 | 127.9 | 145.5 | 120.6 | 53.6 | 16.2 | 21.1 |
| 2001 | 23.0 | 25.3 | 55.5 | 60.4 | 67.8 | 86.6 | 98.1 | 68.4 | 58.5 | 44.5 | 41.8 | 19.9 |
| 2002 | 14.4 | 11.7 | 23.2 | 43.2 | 38.7 | 69.1 | 154.1 | 50.9 | 30.4 | 39.3 | 25.7 | 11.7 |
| 2003 | 6.8 | 10.3 | 24.6 | 42.8 | 39.8 | 49.7 | 78.4 | 74.9 | 37.3 | 58.5 | 22.3 | 11.5 |
| 2004 | 6.3 | 9.2 | 18.5 | 36.1 | 22.4 | 25.3 | 40.4 | 49.7 | 26.2 | 32.4 | 20.0 | 8.0 |
| 2005 | 6.3 | 6.7 | 19.7 | 16.3 | 29.0 | 30.4 | 64.3 | 46.9 | 36.8 | 35.2 | 13.8 | 8.4 |
| 2006 | 16.1 | 9.2 | 11.9 | 17.3 | 5.5 | W | - | - | - | - | W | - |
| 2007 | - | - | - | - | - | - | - | - | - | - | - | - |
| 2008 | - | - | - | - | - | - | - | - | - | - | - | - |
| 2009 | - | - | - | - | - | - | - | - | - | - | - | - |
| 2010 | - | - | - | - | - | - | - | - | - | - | - | - |
| 2011 | - | - | - | - | - | - | - | - | - | - | - | - |
| 2012 | - | - | - | - | - | - | - | - | - | - | - | - |
| 2013 | - | - | - | - | - | - | - | - | - | - | - | - |
| 2014 | - | - | - | - | - | - | - | - | - | - | - | - |
| 2015 | - | - | - | - | - | - | - | - | - | - | - | - |
| 2016 | - | - | - | - | - | - | - | - | - | - | - | - |
| 2017 | - | - | - | - | - | - | - | - | - | - | - | - |
| 2018 | - | - | - | - | - | - | - | - | - | - | - | - |
| 2019 | - | - | - | - | - | - | - | - | - | - | - | - |
| 2020 | - | - | - | - | - | - | - | - | - | - | - | - |
| 2021 | - | - | - | - | - | - | - | - | - | - | - | - |
| 2022 | - | - | - | |||||||||
| - = No Data Reported; -- = Not Applicable; NA = Not Available; W = Withheld to avoid disclosure of individual company data. |
| Release Date: 6/1/2022 |
| Next Release Date: TBD |