|
Download Data (XLS File) |
|
||||||||
|
||||||||
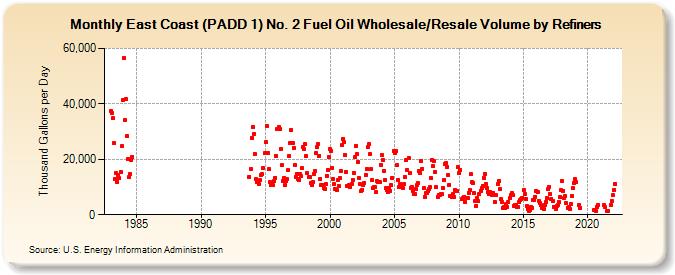
| East Coast (PADD 1) No. 2 Fuel Oil Wholesale/Resale Volume by Refiners (Thousand Gallons per Day) | ||||||||
| Year | Jan | Feb | Mar | Apr | May | Jun | Jul | Aug | Sep | Oct | Nov | Dec |
|---|---|---|---|---|---|---|---|---|---|---|---|---|
| 1983 | 37,379.8 | 36,646.3 | 34,782.7 | 25,804.5 | 12,888.9 | 15,119.4 | 11,808.1 | 14,314.9 | 13,085.1 | 15,451.1 | 24,669.8 | 41,307.8 |
| 1984 | 56,576.2 | 34,019.4 | 41,651.8 | 28,310.4 | 20,014.5 | 13,598.3 | 14,685.6 | 19,807.7 | 20,882.9 | |||
| 1993 | 13,729.2 | 16,425.4 | 27,652.5 | |||||||||
| 1994 | 31,729.1 | 29,287.5 | 22,017.5 | 12,774.1 | 11,683.3 | 11,854.0 | 11,021.2 | 12,342.8 | 14,430.0 | 14,618.9 | 16,902.8 | 22,229.3 |
| 1995 | 26,079.1 | 32,173.1 | 22,263.5 | 16,341.8 | 11,657.4 | 10,795.0 | 10,965.6 | 10,555.3 | 11,997.2 | 13,422.6 | 21,123.6 | 30,746.8 |
| 1996 | 31,598.6 | 30,850.7 | 23,554.9 | 17,810.7 | 12,311.9 | 13,272.4 | 10,645.0 | 12,185.7 | 12,880.5 | 15,972.8 | 21,202.3 | 25,835.9 |
| 1997 | 30,625.0 | 25,758.3 | 24,186.2 | 17,763.2 | 13,616.9 | 14,560.6 | 13,028.2 | 12,581.4 | 14,759.0 | 13,808.9 | 16,705.6 | 24,537.1 |
| 1998 | 23,611.9 | 25,403.8 | 21,133.7 | 15,002.1 | 13,503.7 | 13,620.3 | 11,412.7 | 10,652.3 | 11,750.0 | 14,866.6 | 15,696.8 | 22,162.6 |
| 1999 | 24,412.6 | 25,522.2 | 21,305.0 | 12,979.3 | 10,738.9 | 10,883.9 | 9,642.0 | 9,439.5 | 10,953.5 | 14,078.4 | 16,174.2 | 20,825.1 |
| 2000 | 23,648.7 | 23,080.5 | 16,943.5 | 12,927.1 | 10,993.3 | 9,449.8 | 8,889.7 | 12,349.0 | 10,414.8 | 13,073.3 | 15,942.4 | 25,068.9 |
| 2001 | 27,484.7 | 26,089.8 | 21,454.6 | 15,547.9 | 10,486.0 | 10,237.8 | 10,733.9 | 9,910.9 | 11,067.9 | 12,702.3 | 15,134.2 | 20,759.9 |
| 2002 | 24,881.8 | 21,749.5 | 19,170.5 | 13,211.0 | 10,923.5 | 8,529.6 | 9,026.4 | 10,589.9 | 11,474.6 | 14,504.4 | 16,514.0 | 24,453.6 |
| 2003 | 25,378.9 | 21,898.1 | 16,432.0 | 12,469.8 | 9,511.7 | 9,832.0 | 9,913.1 | 8,200.9 | 12,005.2 | 11,902.6 | 11,631.5 | 18,089.2 |
| 2004 | 21,550.6 | 19,661.0 | 15,874.6 | 12,620.7 | 9,495.1 | 9,010.1 | 8,372.4 | 9,590.2 | 8,713.5 | 10,543.2 | 13,350.6 | 22,897.8 |
| 2005 | 22,331.0 | 23,047.4 | 17,816.3 | 12,464.1 | 9,981.3 | 11,224.2 | 9,835.9 | 9,891.7 | 9,645.8 | 11,062.1 | 13,525.7 | 19,870.1 |
| 2006 | 16,071.1 | 20,505.8 | 14,991.8 | 9,636.7 | 10,097.7 | 8,494.0 | 7,613.2 | 7,501.1 | 9,351.3 | 10,660.8 | 11,359.7 | 15,602.3 |
| 2007 | 15,167.1 | 19,433.9 | 16,658.5 | 9,519.4 | 6,455.1 | 7,757.2 | 7,940.1 | 8,583.4 | 9,387.1 | 9,845.6 | 13,202.8 | 19,706.4 |
| 2008 | 17,565.0 | 19,352.0 | 15,541.5 | 9,929.2 | 6,393.7 | 7,154.3 | 7,028.3 | 7,384.9 | 7,541.3 | 9,808.9 | 12,426.7 | 18,295.4 |
| 2009 | 18,617.7 | 17,335.5 | 14,311.9 | 10,811.7 | 6,706.8 | 6,229.0 | 7,454.3 | 6,534.3 | 9,093.8 | 8,550.1 | 8,414.9 | 17,094.9 |
| 2010 | 15,006.1 | 16,265.9 | NA | 5,535.5 | 5,872.5 | 6,548.1 | 4,574.4 | 6,135.6 | 5,909.7 | 7,992.1 | 8,776.3 | 14,596.4 |
| 2011 | 11,688.6 | 11,294.7 | 7,860.9 | 5,114.4 | 3,246.5 | 6,203.2 | 4,814.5 | 7,340.6 | 8,655.0 | 9,508.7 | 10,447.4 | 13,280.9 |
| 2012 | 14,789.0 | 11,225.3 | 9,659.7 | 8,021.5 | 7,515.4 | 8,163.2 | W | 7,278.3 | 7,993.3 | 4,765.5 | 7,180.4 | W |
| 2013 | 11,091.4 | 12,121.5 | 9,229.2 | 5,580.2 | 4,510.6 | 2,507.9 | 2,696.4 | 2,406.0 | 3,834.8 | 2,758.7 | 4,565.3 | 5,880.3 |
| 2014 | 7,070.3 | 7,833.2 | 7,013.6 | 3,303.0 | 3,397.1 | 3,483.1 | 2,616.8 | 2,951.0 | 4,432.9 | 5,214.2 | 5,695.9 | 6,094.5 |
| 2015 | 9,082.7 | 7,362.1 | 5,794.7 | 3,296.9 | 2,206.0 | 1,503.6 | 1,710.5 | 2,690.3 | 2,532.6 | 5,409.0 | 5,160.7 | 6,493.2 |
| 2016 | 8,592.8 | 8,059.8 | 5,072.3 | 4,290.7 | 3,403.5 | 2,475.6 | 2,772.8 | 2,057.0 | 3,562.6 | 4,705.1 | 6,103.5 | 9,167.9 |
| 2017 | 10,137.3 | 7,433.0 | 5,784.7 | 4,880.6 | 2,913.3 | 2,672.8 | 2,136.7 | 3,171.4 | 3,439.2 | 4,642.6 | 6,216.6 | 8,824.7 |
| 2018 | 12,171.7 | 8,647.7 | 6,094.0 | 6,718.3 | 4,121.2 | 2,527.0 | 2,711.8 | 2,171.5 | 3,948.5 | 6,612.3 | 9,620.9 | 11,483.0 |
| 2019 | 12,725.5 | 11,942.9 | W | W | 3,472.4 | 2,562.5 | W | W | W | W | W | W |
| 2020 | W | W | W | W | W | W | 1,826.9 | 1,287.6 | 2,821.7 | 3,406.6 | W | W |
| 2021 | W | W | W | 3,491.0 | 2,710.9 | W | 1,275.5 | 1,292.3 | W | 3,668.0 | 4,927.0 | 7,164.1 |
| 2022 | 9,090.7 | 11,196.8 | W | |||||||||
| - = No Data Reported; -- = Not Applicable; NA = Not Available; W = Withheld to avoid disclosure of individual company data. |
| Release Date: 6/1/2022 |
| Next Release Date: TBD |