|
Download Data (XLS File) |
|
||||||||
|
||||||||
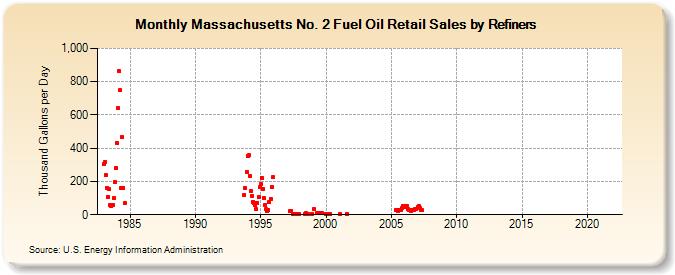
| Massachusetts No. 2 Fuel Oil Retail Sales by Refiners (Thousand Gallons per Day) | ||||||||
| Year | Jan | Feb | Mar | Apr | May | Jun | Jul | Aug | Sep | Oct | Nov | Dec |
|---|---|---|---|---|---|---|---|---|---|---|---|---|
| 1983 | 303.3 | 316.8 | 236.1 | 163.3 | 108.1 | 152.4 | 59.8 | 51.7 | 56.9 | 99.7 | 196.0 | 282.0 |
| 1984 | 431.6 | 639.6 | 861.7 | 748.5 | 163.5 | 467.2 | 160.9 | 67.5 | NA | |||
| 1993 | 120.1 | 157.9 | 256.2 | |||||||||
| 1994 | 351.2 | 356.9 | 233.8 | 140.9 | 115.5 | 79.3 | 71.7 | 57.0 | 33.0 | 70.8 | 105.8 | 164.1 |
| 1995 | 181.9 | 222.3 | 152.8 | 103.3 | 61.2 | 32.0 | 22.2 | 29.4 | 77.7 | 94.7 | 166.3 | 224.4 |
| 1996 | W | W | W | W | W | W | W | W | W | W | W | W |
| 1997 | W | W | W | 20.5 | 24.0 | W | 6.7 | 5.9 | 6.4 | W | 2.5 | 4.3 |
| 1998 | W | W | W | W | W | 4.1 | 7.9 | 4.9 | W | W | W | 6.5 |
| 1999 | W | 32.7 | W | W | 9.6 | W | 8.9 | W | 10.0 | W | W | W |
| 2000 | 3.5 | W | W | 3.7 | 2.2 | W | W | W | W | W | W | W |
| 2001 | W | 3.5 | W | W | W | W | W | 3.0 | W | W | W | W |
| 2002 | W | W | W | W | W | W | W | W | W | W | W | W |
| 2003 | W | W | W | W | W | W | W | W | W | W | W | W |
| 2004 | W | W | W | W | W | W | W | W | W | W | W | W |
| 2005 | W | W | W | W | 27.2 | 27.0 | 24.8 | 30.9 | 26.4 | 29.9 | 38.4 | 54.9 |
| 2006 | 48.3 | 50.2 | 49.4 | 31.8 | 27.7 | 28.7 | 24.4 | 27.4 | 25.7 | 30.6 | 35.8 | 35.5 |
| 2007 | 46.9 | 51.1 | 42.9 | 31.2 | 26.1 | W | W | W | W | W | W | W |
| 2008 | W | W | W | W | W | W | W | W | W | W | W | W |
| 2009 | W | W | W | W | W | W | W | W | W | W | W | W |
| 2010 | W | W | W | W | W | W | W | W | W | W | W | W |
| 2011 | W | W | W | W | W | W | W | W | W | W | W | W |
| 2012 | W | W | W | W | W | W | W | - | W | - | - | W |
| 2013 | W | W | W | W | - | - | - | - | - | NA | NA | - |
| 2014 | - | - | - | - | - | - | - | - | - | - | - | - |
| 2015 | - | - | - | - | - | - | - | - | - | - | - | - |
| 2016 | - | - | - | - | - | - | - | - | - | - | - | - |
| 2017 | - | - | - | - | - | - | - | - | - | - | - | - |
| 2018 | - | - | - | - | - | - | - | - | - | - | - | - |
| 2019 | - | - | - | - | - | - | - | - | - | - | - | - |
| 2020 | - | - | - | - | - | - | - | - | - | - | - | - |
| 2021 | - | - | - | - | - | - | - | - | - | - | - | - |
| 2022 | - | - | - | |||||||||
| - = No Data Reported; -- = Not Applicable; NA = Not Available; W = Withheld to avoid disclosure of individual company data. |
| Release Date: 6/1/2022 |
| Next Release Date: TBD |