|
Download Data (XLS File) |
|
||||||||
|
||||||||
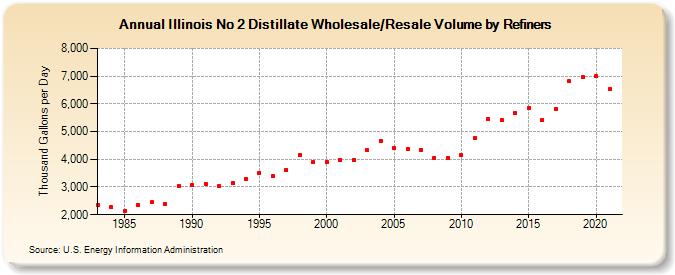
| Illinois No 2 Distillate Wholesale/Resale Volume by Refiners (Thousand Gallons per Day) | ||||||||
| Decade | Year-0 | Year-1 | Year-2 | Year-3 | Year-4 | Year-5 | Year-6 | Year-7 | Year-8 | Year-9 |
|---|---|---|---|---|---|---|---|---|---|---|
| 1980's | 2,361.9 | 2,263.6 | 2,149.5 | 2,348.7 | 2,447.4 | 2,403.8 | 3,041.1 | |||
| 1990's | 3,060.2 | 3,120.8 | 3,026.5 | 3,137.9 | 3,288.5 | 3,520.8 | 3,393.1 | 3,618.6 | 4,156.0 | 3,884.7 |
| 2000's | 3,902.8 | 3,988.8 | 3,985.0 | 4,332.2 | 4,673.8 | 4,403.7 | 4,376.8 | 4,332.1 | 4,061.6 | 4,056.3 |
| 2010's | 4,145.9 | 4,765.3 | 5,446.9 | 5,411.5 | 5,654.5 | 5,834.5 | 5,433.9 | 5,831.3 | 6,807.3 | 6,964.4 |
| 2020's | 7,001.7 |
| - = No Data Reported; -- = Not Applicable; NA = Not Available; W = Withheld to avoid disclosure of individual company data. |
| Release Date: 6/1/2022 |
| Next Release Date: TBD |