|
Download Data (XLS File) |
|
||||||||
|
||||||||
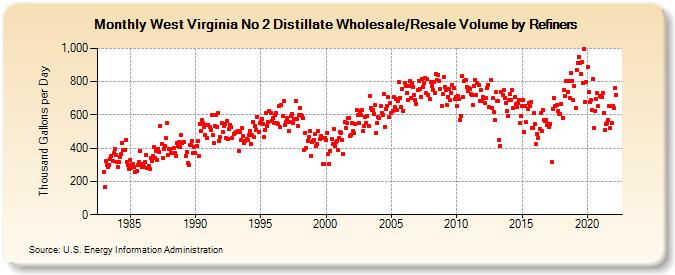
| West Virginia No 2 Distillate Wholesale/Resale Volume by Refiners (Thousand Gallons per Day) | ||||||||
| Year | Jan | Feb | Mar | Apr | May | Jun | Jul | Aug | Sep | Oct | Nov | Dec |
|---|---|---|---|---|---|---|---|---|---|---|---|---|
| 1983 | 258.5 | 167.3 | 322.1 | 301.3 | 287.4 | 301.5 | 337.2 | 350.5 | 322.0 | 370.2 | 393.9 | 358.3 |
| 1984 | 316.1 | 284.7 | 315.9 | 349.0 | 366.3 | 433.9 | 390.3 | 389.3 | 448.6 | 318.6 | 297.8 | 277.1 |
| 1985 | 331.4 | 278.9 | 300.0 | 302.3 | 284.1 | 254.7 | 261.2 | 296.4 | 317.3 | 381.9 | 296.1 | 285.2 |
| 1986 | 306.7 | 283.9 | 316.9 | 358.4 | 281.1 | 295.4 | 272.9 | 338.7 | 325.3 | 354.5 | 405.4 | 338.8 |
| 1987 | 385.5 | 326.7 | 397.2 | 374.8 | 534.0 | 425.3 | 342.2 | 397.4 | 414.4 | 460.3 | 551.0 | 361.6 |
| 1988 | 396.0 | 396.5 | 373.5 | 369.1 | 402.1 | 370.8 | 355.3 | 430.9 | 411.2 | 439.2 | 404.6 | 479.5 |
| 1989 | 432.8 | 435.6 | 434.5 | 355.5 | 376.5 | 309.0 | 298.3 | 420.3 | 416.5 | 442.5 | 370.3 | 407.9 |
| 1990 | 371.8 | 415.8 | 445.6 | 352.4 | 547.4 | 504.3 | 570.2 | 551.6 | 525.8 | 480.5 | 542.1 | 460.9 |
| 1991 | 538.6 | 528.1 | 509.0 | 598.0 | 479.7 | 431.9 | 533.4 | 602.5 | 529.6 | 608.7 | 444.5 | 465.1 |
| 1992 | 551.3 | 499.3 | 532.6 | 544.7 | 461.3 | 561.3 | 454.4 | 512.5 | 542.4 | 527.8 | 461.2 | 484.6 |
| 1993 | 488.7 | 494.5 | 495.3 | 503.5 | 381.3 | 499.7 | 450.0 | 521.1 | 475.7 | 432.4 | 442.7 | 453.1 |
| 1994 | 448.1 | 478.8 | 501.7 | 423.8 | 478.2 | 556.0 | 464.8 | 532.5 | 509.8 | 590.5 | 496.7 | 554.3 |
| 1995 | 560.5 | 576.4 | 544.1 | 466.0 | 510.1 | 609.8 | 532.1 | 558.9 | 622.7 | 611.5 | 566.1 | 578.8 |
| 1996 | 553.4 | 599.2 | 610.7 | 550.6 | 544.4 | 655.1 | 526.2 | 659.2 | 594.9 | 684.6 | 540.1 | 555.6 |
| 1997 | 579.2 | 559.4 | 506.0 | 555.8 | 592.4 | 603.3 | 551.7 | 577.4 | 686.0 | 574.8 | 533.0 | 601.0 |
| 1998 | 643.3 | 597.1 | 592.8 | 581.3 | 386.7 | 492.8 | 399.8 | 444.8 | 464.4 | 501.1 | 355.0 | 439.5 |
| 1999 | 445.3 | 451.3 | 488.0 | 416.1 | 425.6 | 504.7 | 454.1 | 474.2 | 464.0 | 305.0 | 302.3 | 463.2 |
| 2000 | 447.2 | 494.1 | 366.7 | 305.9 | 382.5 | 455.3 | 424.0 | 517.1 | 411.8 | 436.8 | 440.9 | 389.9 |
| 2001 | 460.8 | 497.6 | 492.8 | 450.7 | 365.2 | 555.4 | 523.1 | 554.4 | 579.0 | 584.4 | 472.4 | 478.0 |
| 2002 | 553.5 | 502.9 | 490.4 | 547.7 | 626.8 | 599.4 | 552.9 | 626.4 | 600.9 | 630.6 | 505.2 | 531.9 |
| 2003 | 586.8 | 553.9 | 592.1 | 531.9 | 713.8 | 640.9 | 630.9 | 631.1 | 607.4 | 657.2 | 491.8 | 548.9 |
| 2004 | 585.1 | 580.9 | 650.9 | 612.0 | 601.8 | 725.4 | 529.8 | 634.1 | 655.4 | 704.8 | 589.8 | 670.3 |
| 2005 | 612.4 | 621.6 | 707.5 | 646.3 | 694.9 | 627.6 | 682.0 | 797.7 | 701.9 | 648.9 | 755.6 | 622.8 |
| 2006 | 794.3 | 775.7 | 734.1 | 691.8 | 775.3 | 804.4 | 702.5 | 789.4 | 770.5 | 722.4 | 688.4 | 664.7 |
| 2007 | 747.4 | 803.6 | 756.0 | 709.5 | 818.9 | 767.7 | 791.3 | 822.9 | 729.4 | 814.2 | 717.8 | 694.7 |
| 2008 | 800.9 | 771.7 | 751.6 | 800.1 | 734.7 | 847.2 | 810.5 | 842.3 | 802.7 | 755.7 | 656.1 | 723.8 |
| 2009 | 827.6 | 770.4 | 748.4 | 658.3 | 705.0 | 756.5 | 686.9 | 732.3 | 778.1 | 762.4 | 693.5 | 710.2 |
| 2010 | 656.2 | 715.9 | 694.3 | 569.3 | 594.8 | 831.2 | 705.4 | 806.5 | 812.8 | 769.0 | 744.9 | 764.3 |
| 2011 | 754.6 | 723.5 | 717.3 | 660.5 | 776.3 | 809.5 | 717.9 | 794.3 | 779.0 | 683.9 | 750.0 | 686.5 |
| 2012 | 709.2 | 704.0 | 669.0 | 702.4 | 759.0 | 779.4 | 645.1 | 807.3 | 640.0 | 699.5 | 618.6 | 570.5 |
| 2013 | 735.4 | 685.9 | 683.2 | 448.0 | 413.5 | 735.6 | 717.5 | 751.5 | 699.8 | 674.3 | 622.9 | 592.5 |
| 2014 | 687.8 | 722.8 | 689.9 | 748.0 | 639.8 | 706.3 | 663.9 | 648.0 | 672.1 | 692.6 | 548.7 | 593.2 |
| 2015 | 654.3 | 692.5 | 495.2 | 655.8 | 555.1 | 634.2 | 673.1 | 651.7 | 679.1 | 521.7 | 519.4 | 610.3 |
| 2016 | 546.6 | 426.3 | 484.3 | 461.3 | 518.2 | 612.0 | 500.8 | 629.0 | 571.5 | 563.3 | 567.8 | 539.3 |
| 2017 | 546.3 | 527.1 | 543.4 | 317.5 | 637.9 | 703.9 | 656.5 | NA | 657.3 | 621.6 | 607.1 | 605.9 |
| 2018 | 667.2 | 582.6 | 752.1 | 711.2 | 802.7 | 805.1 | 738.8 | 801.1 | 700.5 | 851.8 | 806.9 | 687.3 |
| 2019 | 774.5 | 643.4 | 870.1 | 912.5 | 946.0 | 909.2 | 845.1 | 915.8 | 790.7 | 997.4 | 678.3 | 800.0 |
| 2020 | 886.8 | 736.4 | 678.6 | 687.6 | 627.1 | 817.4 | 523.9 | 626.0 | 694.0 | 731.0 | 650.7 | 716.2 |
| 2021 | 706.7 | 705.0 | 733.3 | 613.5 | 511.5 | 543.5 | 552.3 | 572.2 | 653.6 | 522.5 | 548.7 | 655.8 |
| 2022 | 643.4 | 764.6 | 720.0 | |||||||||
| - = No Data Reported; -- = Not Applicable; NA = Not Available; W = Withheld to avoid disclosure of individual company data. |
| Release Date: 6/1/2022 |
| Next Release Date: TBD |