|
Download Data (XLS File) |
|
||||||||
|
||||||||
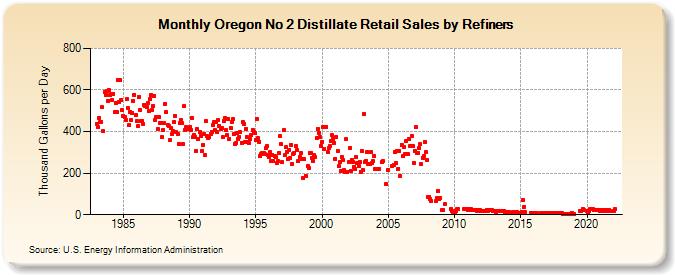
| Oregon No 2 Distillate Retail Sales by Refiners (Thousand Gallons per Day) | ||||||||
| Year | Jan | Feb | Mar | Apr | May | Jun | Jul | Aug | Sep | Oct | Nov | Dec |
|---|---|---|---|---|---|---|---|---|---|---|---|---|
| 1983 | 436.4 | 421.3 | 464.4 | 446.5 | 448.0 | 516.8 | 400.3 | 590.7 | 574.9 | 594.4 | 548.6 | 597.8 |
| 1984 | 576.4 | 581.9 | 551.2 | 581.9 | 492.2 | 538.5 | 493.3 | 646.8 | 541.5 | 647.6 | 551.9 | 505.8 |
| 1985 | 476.3 | 468.4 | 455.6 | 555.8 | 513.5 | 430.5 | 494.4 | 453.9 | 491.4 | 547.8 | 578.2 | 479.1 |
| 1986 | 451.9 | 424.9 | 568.0 | 505.3 | 451.6 | 452.0 | 435.8 | 530.1 | 523.9 | 517.7 | 536.3 | 498.4 |
| 1987 | 555.8 | 576.3 | 503.5 | 524.6 | 571.5 | 456.5 | 468.6 | 413.1 | 469.6 | 442.5 | 441.9 | 372.5 |
| 1988 | 409.0 | 439.8 | 534.3 | 492.3 | 432.7 | 425.6 | 357.1 | 414.9 | 388.2 | 400.8 | 446.8 | 476.9 |
| 1989 | 397.4 | 389.5 | 342.3 | 439.5 | 457.0 | 439.2 | 340.9 | 521.1 | 409.5 | 420.3 | 413.2 | 413.8 |
| 1990 | 423.2 | 409.0 | 466.1 | 373.2 | 384.6 | 375.0 | 304.1 | 410.2 | 364.0 | 397.0 | 379.6 | 306.2 |
| 1991 | 336.2 | 386.2 | 287.6 | 448.7 | 376.4 | 366.8 | 374.5 | 386.1 | 397.3 | 430.0 | 445.2 | 407.9 |
| 1992 | 443.8 | 396.3 | 455.9 | 424.9 | 411.1 | 416.8 | 373.1 | 451.8 | 464.4 | 407.3 | 383.0 | 462.3 |
| 1993 | 366.5 | 419.1 | 447.0 | 458.2 | 387.5 | 340.8 | 345.2 | 393.3 | 366.5 | 375.5 | 396.0 | 346.9 |
| 1994 | 444.8 | 434.9 | 348.9 | 413.6 | 375.0 | 348.7 | 342.7 | 364.0 | 382.9 | 409.2 | 400.1 | 393.5 |
| 1995 | 358.4 | 461.2 | 367.4 | 351.4 | 280.9 | 292.0 | 298.5 | 294.5 | 294.3 | 322.0 | 328.8 | 286.3 |
| 1996 | 276.1 | 299.4 | 260.0 | 287.6 | 259.8 | 280.5 | 278.7 | 248.1 | 259.2 | 296.5 | 376.8 | 338.8 |
| 1997 | 252.8 | 405.8 | 286.0 | 323.6 | 300.8 | 266.7 | 313.4 | 273.8 | 336.6 | 244.2 | 292.9 | 299.2 |
| 1998 | 328.4 | 311.1 | 256.5 | W | 278.0 | 295.3 | 265.9 | 174.9 | 267.1 | 187.7 | W | 234.0 |
| 1999 | 224.3 | 297.2 | 299.2 | 274.3 | 259.2 | 285.9 | 276.5 | 369.3 | 414.3 | 395.0 | 376.1 | 332.8 |
| 2000 | 350.3 | 423.8 | 317.2 | 421.8 | 424.1 | 299.9 | 321.2 | 330.9 | 356.8 | 381.8 | 365.5 | 346.9 |
| 2001 | 269.1 | 372.6 | 308.0 | 233.5 | 253.5 | 208.0 | 277.3 | 261.9 | 213.2 | 203.6 | 362.2 | 207.7 |
| 2002 | 252.8 | 322.4 | 211.5 | 263.0 | 254.8 | 231.6 | 221.2 | 277.3 | 249.7 | 234.0 | 253.2 | 207.5 |
| 2003 | 305.8 | 214.1 | 486.8 | 253.7 | 260.4 | 301.9 | 245.4 | 246.2 | 299.7 | 248.7 | 256.8 | 284.2 |
| 2004 | 220.2 | W | 218.2 | W | 220.1 | W | 254.0 | 257.2 | W | W | 146.5 | W |
| 2005 | 217.0 | W | W | 234.7 | W | 239.7 | 301.5 | 248.5 | 307.8 | 221.8 | 307.1 | 186.4 |
| 2006 | 337.6 | 280.8 | 326.2 | 290.6 | 352.7 | W | 290.0 | 364.0 | 332.0 | 378.5 | 329.0 | 250.6 |
| 2007 | 308.8 | 419.9 | 295.8 | 297.8 | 318.7 | 338.3 | 241.8 | 274.5 | 281.1 | 350.2 | 301.4 | 263.3 |
| 2008 | 87.6 | 87.2 | 74.3 | 64.9 | W | W | W | 64.6 | 79.9 | 115.3 | 75.2 | 80.5 |
| 2009 | NA | 25.0 | 20.9 | 49.3 | W | W | W | W | W | 27.8 | 18.0 | 13.5 |
| 2010 | 12.8 | 15.9 | 26.3 | 27.3 | W | W | W | W | W | 29.1 | 27.1 | 27.8 |
| 2011 | 22.9 | 22.2 | 26.1 | 26.2 | 24.8 | 24.6 | W | 21.2 | 19.5 | 19.2 | 24.1 | 22.0 |
| 2012 | 17.9 | 16.5 | 16.5 | 19.1 | 18.5 | 21.7 | 18.0 | 20.5 | 22.4 | 24.0 | 21.3 | 18.5 |
| 2013 | 17.4 | 17.9 | 14.9 | 17.8 | 18.7 | 16.7 | 17.9 | 18.3 | 19.2 | 19.3 | 14.9 | 15.4 |
| 2014 | 14.5 | 15.3 | 9.9 | 9.4 | 8.8 | 11.5 | 10.4 | 10.3 | 12.0 | 12.2 | 8.8 | 8.8 |
| 2015 | 7.8 | 12.4 | 72.3 | 37.8 | 12.2 | W | W | W | W | 10.5 | 9.0 | 7.8 |
| 2016 | 6.2 | W | 6.8 | 6.7 | W | W | 8.8 | W | 7.4 | 7.2 | 9.5 | 7.4 |
| 2017 | 9.2 | 9.3 | 7.8 | 7.3 | 7.5 | 8.0 | 6.9 | 8.2 | 7.4 | 7.1 | 7.5 | 6.7 |
| 2018 | 7.0 | 7.6 | 3.6 | 3.8 | 4.0 | 4.6 | 4.0 | 4.2 | 4.1 | 3.9 | 8.5 | 5.5 |
| 2019 | 3.1 | W | W | W | W | W | 18.2 | 20.0 | 28.0 | 24.9 | W | W |
| 2020 | 16.0 | 14.1 | 19.4 | 25.1 | 25.9 | 25.8 | 23.5 | 22.8 | 24.6 | 22.9 | 22.1 | 22.2 |
| 2021 | 17.1 | 17.5 | 22.3 | 22.9 | 15.9 | 21.5 | 17.3 | 18.9 | 21.9 | 18.1 | W | W |
| 2022 | 20.2 | 25.5 | W | |||||||||
| - = No Data Reported; -- = Not Applicable; NA = Not Available; W = Withheld to avoid disclosure of individual company data. |
| Release Date: 6/1/2022 |
| Next Release Date: TBD |