|
Download Data (XLS File) |
|
||||||||
|
||||||||
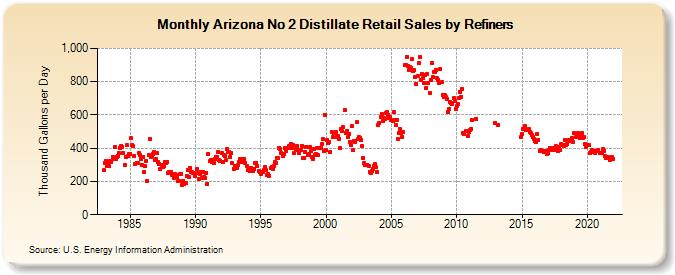
| Arizona No 2 Distillate Retail Sales by Refiners (Thousand Gallons per Day) | ||||||||
| Year | Jan | Feb | Mar | Apr | May | Jun | Jul | Aug | Sep | Oct | Nov | Dec |
|---|---|---|---|---|---|---|---|---|---|---|---|---|
| 1983 | 267.1 | 308.3 | 325.8 | 293.2 | 309.8 | 291.1 | 324.5 | 319.5 | 347.9 | 335.4 | 405.5 | 333.9 |
| 1984 | 347.8 | 354.6 | 370.5 | 399.0 | 415.9 | 407.5 | 373.5 | 300.0 | 349.7 | 418.3 | 350.2 | 366.3 |
| 1985 | 368.0 | 462.3 | 419.3 | 410.4 | 354.3 | 307.4 | 309.8 | 312.3 | 368.7 | 356.6 | 335.5 | 300.8 |
| 1986 | 349.0 | 257.9 | 290.0 | 320.1 | 201.9 | 358.0 | 457.9 | 346.5 | 351.3 | 365.3 | 377.1 | 329.7 |
| 1987 | 334.0 | 368.1 | 316.5 | 303.5 | 272.6 | 301.9 | 284.5 | 291.5 | 319.6 | 310.2 | 319.8 | 248.1 |
| 1988 | 259.7 | 257.9 | 257.3 | 236.0 | 222.9 | 247.7 | 240.5 | 229.6 | 203.0 | 205.5 | 243.6 | 243.5 |
| 1989 | 176.0 | 203.3 | 183.3 | 188.7 | 231.5 | 267.1 | 228.6 | 283.1 | 257.7 | 255.0 | 253.8 | 248.5 |
| 1990 | 234.7 | 272.4 | 250.3 | 215.0 | 247.4 | 256.5 | 222.6 | 259.1 | 228.7 | 221.1 | 252.5 | 186.3 |
| 1991 | 364.5 | 320.9 | 327.6 | 318.6 | 330.5 | 313.8 | 333.1 | 349.2 | 346.5 | 378.3 | 326.2 | 324.6 |
| 1992 | 372.5 | 316.2 | 360.8 | 351.4 | 327.1 | 394.5 | 375.4 | 375.5 | 348.2 | 370.1 | 309.1 | 277.0 |
| 1993 | 295.7 | 294.1 | 282.6 | 301.8 | 314.1 | 334.8 | 315.7 | 324.3 | 333.9 | 337.8 | 311.3 | 290.1 |
| 1994 | 267.9 | 270.4 | 262.7 | 281.2 | 270.1 | 262.3 | 275.3 | 312.9 | 313.4 | 293.5 | 265.6 | 255.4 |
| 1995 | 247.6 | 257.1 | 258.1 | 268.2 | 286.5 | 265.9 | 238.6 | 244.5 | 233.0 | 278.9 | 289.7 | 273.9 |
| 1996 | 294.2 | 317.4 | 312.3 | 343.4 | 338.9 | 402.9 | 394.1 | 370.7 | 352.7 | 365.3 | 398.9 | 382.7 |
| 1997 | 400.0 | 399.9 | 411.4 | 401.3 | 428.0 | 404.0 | 418.3 | 369.8 | 395.1 | 414.6 | 386.7 | 368.2 |
| 1998 | 391.7 | 389.0 | 414.8 | 339.8 | 341.8 | 378.1 | 409.9 | 358.5 | 362.1 | 405.1 | 381.2 | 345.1 |
| 1999 | 333.7 | 397.4 | 359.5 | 365.7 | 399.5 | 356.3 | 401.5 | 398.5 | 424.8 | 452.8 | 385.5 | 601.4 |
| 2000 | 386.9 | 446.6 | 432.7 | 434.7 | 376.2 | 497.6 | 466.3 | 492.3 | 489.5 | 496.8 | 469.6 | 472.5 |
| 2001 | 456.7 | 402.3 | 514.4 | 501.0 | 525.8 | 632.5 | 489.2 | 503.8 | 465.2 | 487.7 | 440.0 | 419.8 |
| 2002 | 532.8 | 387.0 | 446.2 | 439.5 | 555.9 | 453.3 | 466.4 | 463.0 | 451.5 | 414.1 | 342.7 | 313.4 |
| 2003 | 299.8 | 298.8 | 300.5 | 291.4 | 257.1 | 253.2 | 263.3 | 275.3 | 295.5 | 302.7 | 284.0 | 258.7 |
| 2004 | 542.2 | 550.2 | 586.5 | 605.3 | 562.6 | 579.6 | 575.0 | 613.8 | 616.7 | 602.1 | 582.7 | 584.7 |
| 2005 | 571.7 | 563.4 | 615.9 | 568.8 | 541.4 | 570.2 | 456.5 | 490.9 | 512.5 | 490.3 | 467.7 | 500.3 |
| 2006 | 898.3 | 898.5 | 950.1 | 893.0 | 870.3 | 890.4 | 879.2 | 935.0 | 862.5 | 868.5 | 830.4 | 788.4 |
| 2007 | 833.9 | 911.0 | 945.6 | 807.8 | 848.9 | 820.3 | 791.5 | 839.6 | 764.2 | 847.1 | 790.4 | 733.8 |
| 2008 | 809.4 | 910.7 | 826.1 | 861.0 | 857.7 | 869.2 | 820.5 | 812.9 | 794.4 | 876.7 | 795.9 | 722.0 |
| 2009 | 709.4 | 718.5 | 706.2 | 698.7 | 619.7 | 638.3 | 678.7 | 671.0 | 662.9 | 699.5 | 683.1 | 637.4 |
| 2010 | 653.5 | 666.6 | 699.5 | 737.8 | 709.5 | 755.1 | 489.9 | 485.9 | 502.4 | W | 473.2 | 497.6 |
| 2011 | 508.8 | 512.8 | 571.9 | W | W | W | 576.9 | W | W | W | W | W |
| 2012 | W | W | W | W | W | W | W | W | W | W | W | 552.8 |
| 2013 | W | W | 537.7 | W | W | W | W | W | W | W | W | W |
| 2014 | W | W | W | W | W | W | W | W | W | W | W | 468.2 |
| 2015 | 485.0 | 516.8 | 514.1 | 532.1 | 507.4 | 508.0 | 516.2 | 497.9 | 488.3 | 479.5 | 467.1 | 456.4 |
| 2016 | 440.4 | 435.5 | 485.1 | 449.2 | 381.2 | 388.5 | W | 381.5 | 377.0 | 383.1 | 381.8 | 363.8 |
| 2017 | 369.3 | 391.0 | 403.6 | NA | 389.8 | 400.0 | 387.1 | 411.6 | 402.1 | 381.3 | 405.8 | 386.1 |
| 2018 | 422.2 | 420.3 | 415.7 | 450.4 | 416.3 | 425.5 | W | 450.2 | 441.5 | 442.2 | 460.1 | 438.1 |
| 2019 | 489.1 | 464.8 | 481.4 | 489.2 | 475.1 | 460.1 | 484.2 | 489.6 | 463.6 | 465.2 | 425.6 | 406.1 |
| 2020 | 421.3 | 417.6 | 374.0 | 376.8 | 387.3 | 381.0 | 385.5 | 371.0 | 382.4 | 384.8 | 386.4 | 373.8 |
| 2021 | 369.5 | 369.0 | 392.5 | 385.1 | 355.2 | 343.7 | 342.2 | 345.1 | 338.7 | 327.9 | 348.5 | 335.1 |
| 2022 | W | W | W | |||||||||
| - = No Data Reported; -- = Not Applicable; NA = Not Available; W = Withheld to avoid disclosure of individual company data. |
| Release Date: 6/1/2022 |
| Next Release Date: TBD |