|
Download Data (XLS File) |
|
||||||||
|
||||||||
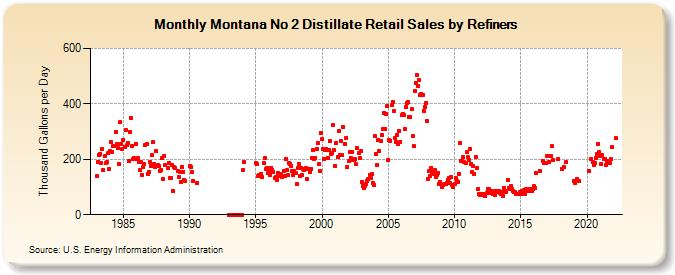
| Montana No 2 Distillate Retail Sales by Refiners (Thousand Gallons per Day) | ||||||||
| Year | Jan | Feb | Mar | Apr | May | Jun | Jul | Aug | Sep | Oct | Nov | Dec |
|---|---|---|---|---|---|---|---|---|---|---|---|---|
| 1983 | 138.6 | 191.2 | 216.2 | 220.2 | 185.7 | 236.2 | 160.7 | 211.3 | 185.0 | 190.5 | 221.5 | 165.7 |
| 1984 | 228.1 | 261.7 | 226.8 | 247.8 | 246.8 | 297.3 | 254.8 | 238.9 | 183.5 | 333.1 | 255.6 | 238.5 |
| 1985 | 269.8 | 245.5 | 304.2 | 251.2 | 259.7 | 192.0 | 298.3 | 349.4 | 248.0 | 200.6 | 203.3 | 256.5 |
| 1986 | 199.7 | 206.2 | 191.4 | 161.9 | 189.6 | 142.6 | 172.1 | 182.0 | 251.6 | 255.6 | 145.8 | 155.8 |
| 1987 | 188.7 | 177.0 | 213.9 | 261.0 | 183.4 | 171.9 | 228.5 | 178.7 | 175.7 | 158.7 | 161.6 | 203.1 |
| 1988 | 128.1 | 212.9 | 177.9 | W | 166.9 | 188.0 | 131.7 | 131.0 | 180.9 | 84.1 | 171.3 | 168.9 |
| 1989 | W | 158.6 | 136.6 | 155.8 | 119.2 | 173.1 | 155.0 | 124.2 | 120.3 | W | W | W |
| 1990 | 175.1 | 171.5 | 152.4 | 121.8 | W | W | W | 114.4 | W | W | W | W |
| 1991 | W | W | W | W | W | W | W | W | W | W | W | W |
| 1992 | W | W | W | W | W | W | W | W | W | W | W | W |
| 1993 | 0.0 | 0.0 | 0.0 | 0.0 | 0.0 | 0.0 | 0.0 | 0.0 | 0.0 | 0.0 | 0.0 | 0.0 |
| 1994 | 159.9 | 188.6 | W | W | W | W | W | W | W | W | W | W |
| 1995 | 184.9 | 182.1 | 140.3 | 144.9 | 144.7 | 146.1 | 136.9 | 186.5 | 203.1 | 164.1 | 169.3 | 148.9 |
| 1996 | 154.4 | 142.6 | 170.3 | 163.1 | 155.6 | 132.5 | 135.8 | 127.0 | 151.3 | 137.9 | 147.0 | 143.9 |
| 1997 | 135.7 | 159.4 | 139.9 | 199.7 | 160.1 | 142.9 | 186.4 | 182.8 | 175.6 | 159.1 | 141.6 | 158.1 |
| 1998 | 149.6 | 109.7 | 167.1 | 182.7 | 140.3 | 168.0 | 142.3 | 166.2 | 161.6 | 168.8 | 128.8 | 165.2 |
| 1999 | 166.1 | 152.8 | 163.3 | 203.2 | 232.5 | 200.5 | 204.4 | 236.3 | 258.3 | 181.7 | 158.7 | 296.0 |
| 2000 | 271.9 | 238.6 | 202.0 | 232.9 | 236.3 | 205.6 | 232.1 | 264.4 | 218.8 | 222.7 | 322.5 | 232.8 |
| 2001 | 177.0 | 259.8 | 209.8 | 303.4 | 213.8 | 267.2 | 217.2 | 317.3 | W | 255.2 | 277.1 | 172.8 |
| 2002 | 193.5 | 224.6 | 205.1 | 227.9 | 198.5 | 196.1 | 199.5 | 181.4 | 240.3 | 223.2 | 203.4 | 228.3 |
| 2003 | 119.4 | 105.0 | 95.4 | 102.4 | 111.1 | 121.0 | 128.0 | 144.0 | 131.3 | 145.4 | 115.2 | 108.5 |
| 2004 | 283.4 | 220.5 | 177.6 | 270.4 | 228.4 | 264.4 | 288.8 | 308.6 | 368.2 | 309.0 | 363.9 | 390.7 |
| 2005 | 197.2 | 269.2 | 267.2 | 395.7 | 408.4 | 373.6 | 276.5 | 262.5 | 286.8 | 256.6 | 303.3 | 263.5 |
| 2006 | 358.2 | 363.5 | 361.1 | 310.4 | 386.9 | 402.5 | 406.2 | 353.5 | 354.1 | 382.0 | 283.6 | 246.7 |
| 2007 | 446.9 | 475.1 | 504.6 | 464.3 | 484.5 | 433.2 | 435.9 | 432.2 | 375.4 | 390.2 | 402.5 | 337.8 |
| 2008 | 130.6 | 156.6 | 138.5 | 169.8 | 154.3 | 146.2 | 160.5 | 134.5 | 141.5 | 150.0 | 110.2 | 117.9 |
| 2009 | 109.0 | 99.3 | 105.7 | 111.5 | 111.0 | 115.4 | 124.2 | 133.7 | 112.9 | 135.8 | 107.9 | 101.3 |
| 2010 | 109.0 | 131.9 | 121.1 | 117.7 | 148.6 | 258.0 | 193.9 | 192.5 | 207.2 | 191.3 | 187.0 | 224.9 |
| 2011 | 206.9 | 199.0 | 237.6 | 184.4 | 154.9 | 176.5 | 145.7 | 208.0 | 169.9 | 92.5 | 73.0 | 72.0 |
| 2012 | 74.6 | 74.2 | 72.3 | 75.3 | 66.7 | 77.9 | 93.1 | 93.0 | 79.0 | 82.2 | 86.0 | 74.8 |
| 2013 | 81.3 | 71.8 | 85.1 | 80.5 | 87.3 | 80.1 | 74.8 | 83.0 | 68.0 | 97.3 | 87.2 | 80.3 |
| 2014 | 123.5 | 96.5 | 91.5 | 104.0 | 92.8 | 84.6 | 81.1 | 81.7 | 75.3 | NA | 74.2 | 82.8 |
| 2015 | 74.5 | 84.2 | 80.3 | 87.6 | 76.5 | 94.4 | 86.5 | 86.7 | 94.1 | 91.6 | 86.2 | 93.4 |
| 2016 | 102.1 | 95.8 | 150.1 | W | W | 159.5 | W | W | 194.9 | 184.8 | W | 187.9 |
| 2017 | 212.5 | W | 191.6 | 213.4 | 248.4 | 197.4 | W | W | W | W | 200.3 | W |
| 2018 | W | 166.6 | W | 172.6 | W | 189.5 | W | W | W | W | W | W |
| 2019 | 122.9 | 114.0 | W | 128.0 | W | 120.6 | W | W | W | W | W | W |
| 2020 | W | W | 157.5 | W | 200.8 | 189.5 | 180.9 | 187.0 | 204.9 | 219.7 | 256.3 | 225.6 |
| 2021 | 210.9 | 182.3 | 215.2 | 201.5 | 200.6 | 180.0 | 194.0 | 186.7 | W | 186.6 | 199.6 | 244.1 |
| 2022 | W | W | 276.4 | |||||||||
| - = No Data Reported; -- = Not Applicable; NA = Not Available; W = Withheld to avoid disclosure of individual company data. |
| Release Date: 6/1/2022 |
| Next Release Date: TBD |