|
Download Data (XLS File) |
|
||||||||
|
||||||||
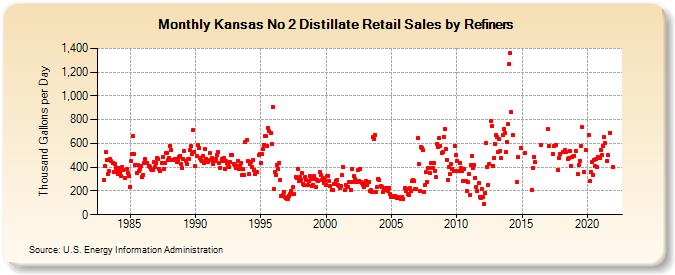
| Kansas No 2 Distillate Retail Sales by Refiners (Thousand Gallons per Day) | ||||||||
| Year | Jan | Feb | Mar | Apr | May | Jun | Jul | Aug | Sep | Oct | Nov | Dec |
|---|---|---|---|---|---|---|---|---|---|---|---|---|
| 1983 | 293.9 | 407.1 | 525.9 | 456.7 | 342.2 | 363.9 | 467.2 | 450.2 | 438.9 | 362.2 | 430.9 | 395.0 |
| 1984 | 356.0 | 342.8 | 396.5 | 360.7 | 321.9 | 404.4 | 376.1 | 311.3 | W | 383.5 | 349.2 | 324.6 |
| 1985 | 233.3 | 451.4 | 514.2 | 658.4 | 510.4 | 422.0 | 352.2 | 418.0 | 365.4 | 380.8 | 406.6 | 320.1 |
| 1986 | 331.3 | 436.6 | 472.8 | 438.3 | 436.7 | 407.7 | 400.3 | 387.7 | 373.7 | 373.0 | 439.6 | 405.0 |
| 1987 | 439.3 | 480.9 | 470.5 | 385.3 | 372.1 | 439.5 | 487.7 | 383.5 | 433.4 | 519.6 | 520.7 | 459.7 |
| 1988 | 480.3 | 581.1 | 543.0 | 456.8 | 461.8 | 469.4 | 466.8 | 445.8 | 458.1 | 482.4 | 497.3 | 426.7 |
| 1989 | 393.8 | 467.1 | 540.0 | 455.4 | 427.2 | 467.4 | 469.5 | 543.8 | 574.8 | 506.9 | 709.9 | 531.9 |
| 1990 | 409.8 | 494.2 | 582.6 | 558.3 | 480.9 | 461.3 | 451.5 | 496.3 | 432.7 | 550.9 | 471.8 | 462.6 |
| 1991 | 446.0 | 517.4 | 463.7 | 481.5 | 429.9 | 454.2 | 456.0 | 468.0 | 501.7 | 531.2 | 437.6 | 395.1 |
| 1992 | 465.4 | 453.2 | 478.9 | 388.9 | 455.7 | 434.8 | 420.7 | 403.8 | 442.3 | 506.4 | 503.5 | 428.8 |
| 1993 | 416.5 | 392.3 | 405.9 | 454.8 | 388.5 | 411.7 | 437.3 | 334.9 | 381.5 | 336.8 | 612.8 | 629.3 |
| 1994 | 448.1 | 339.5 | 426.7 | 444.6 | 402.3 | 462.0 | 376.5 | 346.1 | 361.2 | 359.2 | 500.0 | 508.7 |
| 1995 | 439.4 | 514.9 | 549.6 | 590.3 | 665.7 | 659.7 | 578.6 | 733.8 | 701.1 | 690.7 | 595.5 | 910.3 |
| 1996 | 218.2 | 361.3 | 336.7 | 418.0 | 386.6 | 438.8 | 294.6 | 160.8 | 163.4 | 189.5 | 151.1 | 141.1 |
| 1997 | 135.9 | 135.4 | 158.1 | 170.7 | 203.1 | 177.7 | 232.4 | 174.1 | 319.9 | 312.1 | 385.3 | 281.3 |
| 1998 | 314.4 | 295.7 | 349.8 | 260.1 | 252.1 | 318.6 | 290.5 | 250.4 | 280.3 | 321.8 | 299.4 | 239.7 |
| 1999 | 253.6 | 322.4 | 302.1 | 229.2 | 292.6 | 284.7 | 360.0 | 333.8 | 294.9 | 305.1 | 266.0 | 289.4 |
| 2000 | 252.4 | 323.1 | 329.0 | 285.0 | 237.6 | 205.0 | 207.3 | 258.7 | 262.1 | 284.0 | 289.0 | 248.1 |
| 2001 | 239.7 | 223.4 | 240.0 | 334.2 | 403.7 | 211.2 | 251.8 | 233.1 | 234.1 | 276.2 | 275.0 | 209.9 |
| 2002 | 385.3 | 276.4 | 322.5 | 303.4 | 271.3 | 372.9 | 282.3 | 384.7 | 273.7 | 267.1 | 251.0 | 231.5 |
| 2003 | 259.6 | 283.3 | 248.7 | 275.2 | 196.2 | 204.1 | 193.0 | 651.0 | 635.7 | 673.9 | 191.9 | 234.5 |
| 2004 | 303.6 | 294.1 | 239.4 | 235.2 | 188.9 | 215.8 | 205.5 | 223.0 | 226.3 | 201.1 | 224.3 | 171.5 |
| 2005 | 152.2 | 153.1 | 153.5 | 160.9 | 150.2 | 143.0 | 145.8 | 136.7 | 144.5 | 128.1 | 148.7 | 131.5 |
| 2006 | 221.9 | 195.6 | 218.1 | 178.4 | 168.0 | 223.8 | 199.2 | 280.0 | 288.8 | 284.4 | 219.9 | 213.5 |
| 2007 | 644.7 | 425.4 | 203.6 | 569.7 | 563.2 | 542.4 | 193.6 | 246.8 | 357.1 | 279.5 | 391.1 | 351.2 |
| 2008 | 436.6 | 393.8 | 390.5 | 434.4 | 369.4 | 315.8 | 598.8 | 567.5 | 645.3 | 582.2 | 519.5 | 525.3 |
| 2009 | 656.6 | 717.9 | 554.9 | 462.7 | 295.5 | 398.6 | 338.7 | 423.5 | 386.8 | 368.3 | 577.5 | 499.1 |
| 2010 | 453.2 | 364.6 | 370.1 | 435.0 | 392.0 | 364.9 | 285.5 | 381.9 | 282.0 | 201.0 | 275.8 | 342.1 |
| 2011 | 168.2 | 417.2 | 496.0 | 389.3 | 414.3 | 311.9 | 236.0 | 201.6 | 266.5 | 151.6 | 142.5 | 217.7 |
| 2012 | 150.8 | 90.5 | 184.6 | 604.7 | 398.8 | 249.2 | 428.0 | 785.2 | 749.2 | 412.2 | 479.8 | 596.5 |
| 2013 | 667.0 | 655.5 | 528.0 | 634.0 | 537.3 | 476.6 | 669.3 | 718.7 | 685.6 | 525.6 | 608.2 | 761.2 |
| 2014 | 1,271.6 | 1,362.6 | 862.7 | W | 668.2 | W | W | 275.7 | 482.0 | W | W | 558.0 |
| 2015 | W | W | W | 521.1 | W | W | W | W | W | 210.8 | 394.2 | 484.3 |
| 2016 | 441.3 | W | W | W | W | 586.8 | W | W | W | W | W | W |
| 2017 | 719.6 | 575.6 | W | W | 511.1 | 577.9 | W | 589.8 | W | 379.6 | 480.0 | 513.6 |
| 2018 | W | 529.8 | W | 543.2 | 530.2 | W | 465.4 | 479.1 | 539.0 | 413.7 | 484.0 | W |
| 2019 | 497.4 | 539.9 | W | 342.3 | 415.4 | 455.6 | 579.8 | 734.3 | W | 358.3 | W | 546.4 |
| 2020 | W | 672.9 | 280.9 | 360.9 | 440.7 | 336.5 | 463.5 | 409.5 | 465.6 | 398.7 | 486.3 | 473.4 |
| 2021 | 547.5 | 500.8 | 578.4 | 652.8 | 600.7 | W | 454.6 | 500.5 | W | 690.3 | W | 405.7 |
| 2022 | W | W | W | |||||||||
| - = No Data Reported; -- = Not Applicable; NA = Not Available; W = Withheld to avoid disclosure of individual company data. |
| Release Date: 6/1/2022 |
| Next Release Date: TBD |