|
Download Data (XLS File) |
|
||||||||
|
||||||||
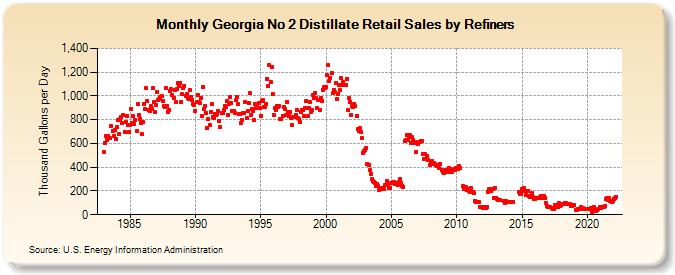
| Georgia No 2 Distillate Retail Sales by Refiners (Thousand Gallons per Day) | ||||||||
| Year | Jan | Feb | Mar | Apr | May | Jun | Jul | Aug | Sep | Oct | Nov | Dec |
|---|---|---|---|---|---|---|---|---|---|---|---|---|
| 1983 | 526.1 | 601.2 | 660.0 | 629.7 | 662.5 | 642.3 | 641.8 | 744.7 | 705.9 | 664.4 | 712.8 | 638.5 |
| 1984 | 736.2 | 798.7 | 683.2 | 803.4 | 823.8 | 775.9 | 842.5 | 698.3 | 783.2 | 834.8 | 753.3 | 696.5 |
| 1985 | 756.2 | 893.0 | 770.8 | 827.2 | 762.0 | 794.1 | 705.4 | 931.2 | 839.4 | 804.2 | 774.6 | 680.5 |
| 1986 | 777.4 | 928.2 | 886.3 | 1,064.2 | 955.0 | 880.3 | 869.6 | 914.6 | 892.3 | 1,063.8 | 947.9 | 862.0 |
| 1987 | 923.9 | 1,032.0 | 966.2 | 977.0 | 990.2 | 996.2 | 959.5 | 915.8 | 903.1 | 1,069.9 | 914.6 | 868.3 |
| 1988 | 883.6 | 1,037.4 | 1,057.5 | 1,007.1 | 984.0 | 1,045.8 | 946.7 | 1,059.3 | 1,104.9 | 1,083.5 | 1,112.4 | 949.2 |
| 1989 | 1,013.9 | 1,062.7 | 1,087.3 | 1,002.7 | 1,014.3 | 980.8 | 976.6 | 1,047.3 | 993.3 | 967.4 | 930.8 | 925.3 |
| 1990 | 876.5 | 949.8 | 1,003.8 | 946.2 | 941.4 | 985.2 | 833.5 | 1,078.6 | 889.9 | 915.0 | 856.7 | 731.5 |
| 1991 | 802.8 | 753.5 | 867.6 | 936.1 | 821.3 | 814.6 | 849.1 | 841.7 | 844.5 | 875.3 | 787.0 | 736.7 |
| 1992 | 855.5 | 853.1 | 879.1 | 917.5 | 908.5 | 953.2 | 835.4 | 928.8 | 990.3 | 941.7 | 876.2 | 875.1 |
| 1993 | 852.1 | 962.2 | 987.9 | 930.8 | 845.9 | 848.2 | 770.9 | 798.2 | 853.7 | 859.5 | 948.9 | 811.7 |
| 1994 | 875.9 | 936.6 | 1,020.8 | 842.1 | 892.9 | 874.7 | 795.2 | 932.5 | 894.6 | 930.4 | 938.2 | 900.9 |
| 1995 | 831.1 | 953.8 | 961.7 | 906.2 | 906.7 | 933.5 | 1,146.4 | 1,083.6 | 1,257.2 | 1,117.2 | 1,244.9 | 1,017.2 |
| 1996 | 842.0 | 896.9 | 880.7 | 916.6 | 906.8 | 913.9 | 808.1 | 802.6 | 834.2 | 905.7 | 893.4 | 837.6 |
| 1997 | 950.9 | 867.8 | 832.3 | 862.0 | 816.1 | 754.9 | 821.8 | 819.8 | 841.5 | 884.5 | 818.0 | 808.7 |
| 1998 | 779.5 | 865.2 | 881.5 | 881.3 | 830.8 | 900.0 | 959.3 | 828.6 | 898.8 | 952.6 | 865.3 | 879.8 |
| 1999 | 1,008.5 | 984.4 | 1,028.1 | 982.5 | 896.1 | 962.8 | 880.8 | 982.0 | 955.3 | 1,052.4 | 1,071.4 | 1,065.0 |
| 2000 | 1,072.4 | 1,174.1 | 1,259.2 | 1,129.5 | 1,150.7 | 1,192.0 | 1,022.3 | 1,051.3 | 1,034.7 | 1,110.4 | 973.8 | 1,016.6 |
| 2001 | 1,087.8 | 1,049.5 | 1,147.6 | 1,093.8 | 1,116.4 | 1,093.0 | 1,094.1 | 1,141.7 | 878.7 | 978.8 | 949.2 | 840.8 |
| 2002 | 916.5 | 906.1 | 936.0 | 914.2 | 832.8 | 720.1 | 706.8 | 733.5 | 699.5 | 646.1 | 522.2 | 536.5 |
| 2003 | 546.1 | 565.3 | 427.8 | 420.2 | 374.2 | 346.3 | 304.2 | 280.8 | 272.4 | 269.7 | 240.2 | 262.7 |
| 2004 | 240.1 | 204.2 | 220.4 | 228.7 | 220.5 | 219.8 | 246.8 | 253.2 | 280.1 | 261.3 | 224.2 | 226.2 |
| 2005 | 266.7 | 276.3 | 278.6 | 260.2 | 263.5 | 261.6 | 248.2 | 277.6 | 297.4 | 266.1 | 245.7 | 235.9 |
| 2006 | 621.2 | 625.9 | 672.4 | 632.4 | 653.2 | 670.3 | 603.1 | 655.1 | 629.2 | 601.9 | 612.4 | 532.0 |
| 2007 | 592.9 | 610.3 | 612.4 | 623.1 | 617.8 | 511.1 | 470.1 | 506.9 | 468.4 | 491.9 | 456.8 | 417.9 |
| 2008 | 443.5 | 455.8 | 430.1 | 436.0 | 423.6 | 417.6 | 411.7 | 410.8 | 391.5 | 424.4 | 376.5 | 361.4 |
| 2009 | 348.4 | 371.4 | 379.3 | 366.0 | 362.8 | 393.5 | 381.1 | 371.8 | 362.6 | 382.6 | 375.8 | 389.2 |
| 2010 | 387.4 | 385.9 | 408.1 | 396.0 | NA | NA | 245.9 | 220.4 | 229.2 | 208.9 | 218.7 | 201.0 |
| 2011 | 195.4 | 228.9 | 189.5 | 194.7 | 179.5 | 115.4 | 110.5 | 110.1 | 103.9 | 64.3 | 62.7 | 62.5 |
| 2012 | 55.5 | 61.4 | 52.4 | 56.0 | 63.7 | 191.2 | 216.2 | 196.4 | 219.1 | 218.3 | 139.1 | 226.5 |
| 2013 | 142.6 | 136.4 | 125.3 | 122.2 | 123.6 | W | W | 113.9 | 96.4 | 114.1 | 109.3 | 105.7 |
| 2014 | W | 104.5 | 104.4 | 106.2 | 109.4 | W | W | W | W | 192.3 | 170.8 | 171.9 |
| 2015 | 218.8 | 199.3 | 224.1 | 203.7 | 166.0 | 201.2 | 160.0 | 145.4 | 151.6 | 179.1 | 149.5 | 133.6 |
| 2016 | 130.8 | 142.1 | 142.0 | 140.7 | 151.5 | 154.9 | 139.4 | 153.5 | 155.3 | 138.8 | 101.2 | 76.7 |
| 2017 | 61.0 | 63.6 | 63.4 | 56.2 | 51.0 | 49.2 | 81.4 | 84.6 | 66.8 | 65.4 | 94.8 | 76.7 |
| 2018 | 78.5 | 86.0 | 89.2 | 98.3 | 97.8 | 88.1 | 87.2 | 90.6 | 90.1 | 75.4 | 70.3 | 80.6 |
| 2019 | 80.9 | 43.2 | 41.0 | 50.9 | 51.5 | 51.8 | 62.5 | 56.3 | 54.5 | 49.1 | 44.4 | 48.3 |
| 2020 | 45.8 | 45.4 | 44.8 | 59.9 | 25.2 | 30.6 | 67.6 | 33.2 | 32.1 | 41.7 | 49.4 | 61.1 |
| 2021 | 59.9 | 68.8 | 66.9 | 67.5 | 74.1 | 133.0 | 137.0 | 122.4 | 137.6 | 117.2 | 107.8 | 115.7 |
| 2022 | 135.1 | 138.5 | 151.6 | |||||||||
| - = No Data Reported; -- = Not Applicable; NA = Not Available; W = Withheld to avoid disclosure of individual company data. |
| Release Date: 6/1/2022 |
| Next Release Date: TBD |