|
Download Data (XLS File) |
|
||||||||
|
||||||||
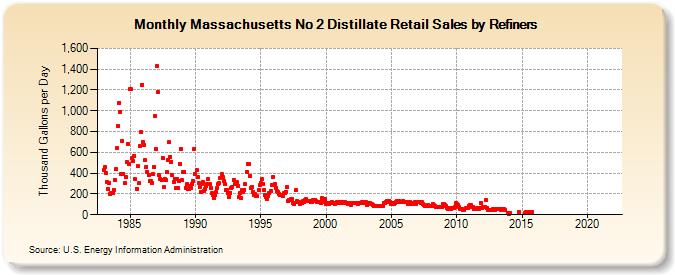
| Massachusetts No 2 Distillate Retail Sales by Refiners (Thousand Gallons per Day) | ||||||||
| Year | Jan | Feb | Mar | Apr | May | Jun | Jul | Aug | Sep | Oct | Nov | Dec |
|---|---|---|---|---|---|---|---|---|---|---|---|---|
| 1983 | 434.6 | 456.5 | 400.3 | 314.7 | 248.9 | 307.1 | 197.2 | 212.3 | 209.3 | 241.3 | 338.0 | 435.8 |
| 1984 | 637.3 | 855.0 | 1,078.8 | 990.8 | 388.1 | 708.8 | 394.9 | 303.8 | 365.1 | 506.2 | 683.0 | 484.0 |
| 1985 | 1,205.3 | 1,208.9 | 547.2 | 516.1 | 569.1 | 340.4 | 251.5 | 467.0 | 301.9 | 657.4 | 790.9 | 1,250.9 |
| 1986 | 701.7 | 674.4 | 523.4 | 460.0 | 415.3 | 381.9 | 320.6 | 320.1 | 307.0 | 390.9 | 459.4 | 945.0 |
| 1987 | 630.3 | 1,426.5 | 1,179.0 | 379.1 | 344.5 | 333.9 | 549.5 | 262.4 | 341.9 | 331.2 | 409.4 | 530.3 |
| 1988 | 696.7 | 559.8 | 511.8 | 378.2 | 316.1 | 347.2 | 253.0 | 345.7 | 253.8 | 327.9 | 489.0 | 633.7 |
| 1989 | 330.0 | 415.4 | 411.8 | 260.2 | 291.4 | 243.1 | 252.1 | 275.5 | 254.6 | 298.3 | 321.8 | 634.5 |
| 1990 | 392.1 | 427.1 | 359.2 | 302.1 | 265.4 | 220.8 | 291.6 | 311.1 | 230.0 | 244.1 | 273.5 | 292.0 |
| 1991 | 339.0 | 291.4 | 261.6 | 205.4 | 193.5 | 165.1 | 186.6 | 218.6 | 255.6 | 297.1 | 302.5 | 357.7 |
| 1992 | 391.9 | 359.9 | 325.1 | 292.3 | 238.1 | 233.6 | 210.8 | 174.7 | 213.5 | 258.5 | 266.8 | 336.4 |
| 1993 | 294.7 | 315.0 | 310.5 | 280.8 | 172.3 | 208.5 | 165.2 | 240.5 | 216.0 | 237.9 | 293.6 | 415.5 |
| 1994 | 488.7 | 487.4 | 376.9 | 257.8 | 271.2 | 219.8 | 188.9 | 198.3 | 176.9 | 177.4 | 234.3 | 285.8 |
| 1995 | 305.5 | 341.7 | 294.6 | 235.3 | 188.5 | 173.9 | 152.0 | 177.6 | 208.6 | 226.4 | 288.0 | 359.8 |
| 1996 | 284.5 | 300.1 | 256.9 | 231.1 | 222.9 | 201.2 | 189.2 | 194.1 | 177.4 | 204.1 | 207.2 | 223.3 |
| 1997 | 267.3 | 132.4 | 137.3 | 138.5 | 149.4 | 151.1 | 112.7 | 103.5 | 233.9 | 127.5 | 121.7 | 120.5 |
| 1998 | 103.5 | 108.7 | 110.7 | 127.4 | 118.7 | 139.2 | 148.3 | 132.0 | 128.3 | 133.7 | 124.0 | 127.1 |
| 1999 | 145.7 | 141.6 | 142.3 | 129.8 | 121.7 | 126.4 | 118.8 | 117.1 | 159.6 | 125.7 | 128.7 | 147.7 |
| 2000 | 106.7 | 109.4 | 100.7 | 104.2 | 116.5 | 124.8 | 110.6 | 113.9 | 107.7 | 115.1 | 122.6 | 110.6 |
| 2001 | 122.0 | 109.7 | 117.7 | 115.7 | 123.5 | 120.3 | 110.4 | 111.4 | 99.9 | 114.9 | 104.1 | 93.4 |
| 2002 | 111.5 | 114.8 | 110.6 | 110.1 | 115.1 | 107.0 | 114.7 | 110.2 | 110.0 | 120.0 | 115.4 | 110.4 |
| 2003 | 119.7 | 119.1 | 95.8 | 113.3 | 116.7 | 101.7 | 104.4 | 96.8 | 85.3 | 85.9 | 84.5 | 84.4 |
| 2004 | 83.6 | 86.7 | 85.3 | 88.5 | 86.3 | 115.8 | 114.1 | 122.0 | 133.8 | 123.7 | 132.4 | 118.9 |
| 2005 | 102.9 | 113.7 | 107.3 | 117.0 | 119.1 | 134.5 | 117.9 | 128.6 | 119.4 | 121.7 | 126.9 | 130.6 |
| 2006 | 120.0 | 125.7 | 126.3 | 104.3 | 102.2 | 122.7 | 100.7 | 106.5 | 108.3 | 113.8 | 126.5 | 107.8 |
| 2007 | 123.6 | 122.4 | 120.4 | 113.0 | 119.2 | 100.1 | 95.3 | 88.6 | 86.7 | 83.0 | 88.7 | 88.1 |
| 2008 | 86.8 | 84.8 | 102.0 | 95.8 | 84.1 | 77.4 | 76.4 | 73.9 | 72.7 | 78.4 | 78.6 | 104.6 |
| 2009 | 107.8 | 94.5 | 86.0 | 68.4 | 59.4 | 60.9 | 56.9 | 53.5 | 60.9 | 62.3 | 72.6 | 109.6 |
| 2010 | 106.9 | 95.9 | 70.2 | 58.1 | 53.4 | 58.1 | 45.8 | 45.9 | 61.0 | 62.5 | 61.8 | 88.6 |
| 2011 | 89.7 | 89.4 | 77.1 | 71.1 | 58.0 | 57.3 | 56.0 | 61.1 | 54.9 | 64.1 | 110.4 | 66.9 |
| 2012 | 74.2 | 78.8 | 78.3 | 143.3 | 63.2 | 47.5 | 41.8 | 48.9 | 48.8 | 52.4 | 47.6 | 49.1 |
| 2013 | 52.5 | 57.1 | 56.0 | 55.4 | 52.3 | 48.2 | 54.8 | 50.5 | 48.7 | NA | NA | 17.8 |
| 2014 | 10.3 | 14.6 | W | W | W | W | W | W | W | 23.3 | W | W |
| 2015 | W | W | W | 21.3 | 24.0 | W | 22.8 | 23.3 | 25.4 | 26.2 | W | W |
| 2016 | W | W | W | W | W | W | W | W | W | W | W | W |
| 2017 | W | W | W | W | W | W | W | W | W | W | W | W |
| 2018 | W | W | W | W | W | W | W | W | W | W | W | W |
| 2019 | W | W | W | W | W | W | W | W | W | W | W | W |
| 2020 | W | W | W | W | W | W | W | W | W | W | W | W |
| 2021 | W | W | W | W | W | - | - | - | - | - | - | - |
| 2022 | - | - | - | |||||||||
| - = No Data Reported; -- = Not Applicable; NA = Not Available; W = Withheld to avoid disclosure of individual company data. |
| Release Date: 6/1/2022 |
| Next Release Date: TBD |