|
Download Data (XLS File) |
|
||||||||
|
||||||||
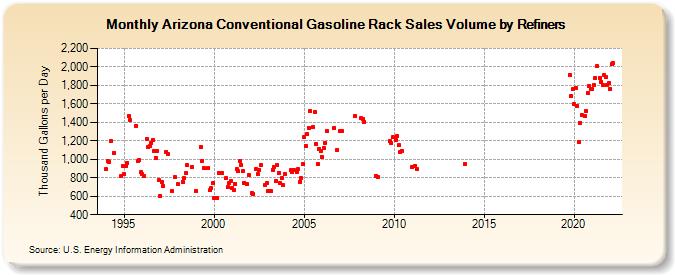
| Arizona Conventional Gasoline Rack Sales Volume by Refiners (Thousand Gallons per Day) | ||||||||
| Year | Jan | Feb | Mar | Apr | May | Jun | Jul | Aug | Sep | Oct | Nov | Dec |
|---|---|---|---|---|---|---|---|---|---|---|---|---|
| 1994 | 889.5 | 978.2 | 973.9 | 1,199.3 | W | 1,072.0 | W | W | W | W | 818.4 | 925.9 |
| 1995 | 836.0 | 927.5 | 961.2 | 1,473.3 | 1,423.7 | W | W | W | 1,362.4 | 983.7 | 992.5 | 857.6 |
| 1996 | 836.7 | 818.1 | W | 1,215.4 | 1,130.3 | 1,147.2 | 1,171.4 | 1,208.1 | 1,087.5 | 1,016.5 | 1,091.7 | 772.3 |
| 1997 | 605.0 | 754.5 | 709.8 | W | 1,081.4 | 1,053.4 | W | W | 653.0 | W | 805.6 | W |
| 1998 | 732.6 | W | W | 754.2 | 793.9 | 850.1 | 933.5 | W | W | 919.0 | W | W |
| 1999 | 654.2 | W | W | 1,131.4 | 981.6 | 904.0 | W | W | 900.6 | 664.0 | 687.5 | 738.1 |
| 2000 | 582.3 | W | 585.7 | 852.2 | W | 854.3 | W | W | 793.6 | 701.3 | 740.7 | 761.7 |
| 2001 | 687.5 | 667.4 | 735.6 | 891.1 | 869.1 | 978.0 | 938.4 | 869.5 | 746.4 | W | 732.7 | 831.2 |
| 2002 | W | 634.1 | 627.3 | W | 898.8 | 838.9 | 884.0 | 933.0 | W | W | 721.2 | 739.5 |
| 2003 | 652.2 | W | 656.0 | 888.8 | 916.8 | 759.8 | 937.6 | 854.2 | 742.2 | 792.3 | 719.8 | 839.5 |
| 2004 | W | W | W | 880.5 | 864.2 | 880.6 | W | 865.1 | 891.2 | 754.7 | 799.1 | 946.2 |
| 2005 | 1,244.6 | 1,141.8 | 1,273.0 | 1,342.4 | 1,517.7 | W | 1,345.2 | 1,516.9 | 1,163.4 | 948.0 | 1,115.7 | 1,084.3 |
| 2006 | 1,025.2 | 1,123.4 | 1,180.1 | 1,306.5 | W | W | W | W | 1,339.1 | W | 1,102.7 | W |
| 2007 | 1,300.7 | 1,304.9 | W | W | W | W | W | W | W | W | 1,467.2 | W |
| 2008 | W | W | 1,443.7 | 1,440.2 | 1,406.3 | W | W | W | W | W | W | W |
| 2009 | 821.1 | 809.1 | W | W | W | W | W | W | W | 1,197.6 | 1,174.8 | 1,237.1 |
| 2010 | W | 1,210.5 | 1,252.4 | 1,151.9 | 1,082.4 | 1,091.6 | W | W | W | W | W | W |
| 2011 | 912.3 | W | 928.2 | 894.5 | W | W | W | W | W | W | W | W |
| 2012 | W | W | W | W | W | W | W | W | W | W | W | W |
| 2013 | W | W | W | W | W | W | W | W | W | W | W | 948.0 |
| 2014 | W | W | W | W | W | W | W | W | W | W | W | W |
| 2015 | W | W | W | W | W | W | W | W | W | W | W | W |
| 2016 | W | W | W | W | W | W | W | W | W | W | W | W |
| 2017 | W | W | W | W | W | W | W | W | W | W | W | W |
| 2018 | W | W | W | W | W | W | W | W | W | W | W | W |
| 2019 | W | W | W | W | W | W | W | W | W | 1,915.7 | 1,686.5 | 1,756.6 |
| 2020 | 1,596.6 | 1,766.8 | 1,575.0 | 1,182.9 | 1,397.3 | 1,476.8 | W | 1,468.9 | 1,523.9 | 1,722.5 | 1,788.4 | 1,761.9 |
| 2021 | 1,756.0 | 1,798.5 | 1,884.2 | 2,004.7 | W | 1,876.4 | 1,836.9 | 1,800.7 | 1,907.4 | 1,891.8 | 1,802.5 | 1,824.4 |
| 2022 | 1,763.0 | 2,025.9 | 2,037.9 | |||||||||
| - = No Data Reported; -- = Not Applicable; NA = Not Available; W = Withheld to avoid disclosure of individual company data. |
| Release Date: 6/1/2022 |
| Next Release Date: TBD |