|
Download Data (XLS File) |
|
||||||||
|
||||||||
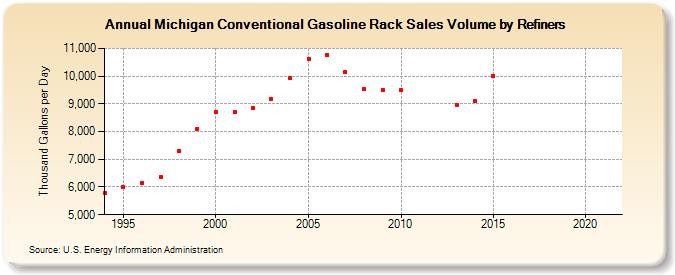
| Michigan Conventional Gasoline Rack Sales Volume by Refiners (Thousand Gallons per Day) | ||||||||
| Decade | Year-0 | Year-1 | Year-2 | Year-3 | Year-4 | Year-5 | Year-6 | Year-7 | Year-8 | Year-9 |
|---|---|---|---|---|---|---|---|---|---|---|
| 1990's | 5,782.3 | 5,985.1 | 6,149.1 | 6,377.8 | 7,306.8 | 8,106.3 | ||||
| 2000's | 8,694.7 | 8,699.3 | 8,841.7 | 9,178.7 | 9,915.9 | 10,625.2 | 10,775.7 | 10,144.5 | 9,520.7 | 9,511.7 |
| 2010's | 9,484.1 | W | W | 8,968.5 | 9,120.0 | 10,006.4 | W | W | W | W |
| 2020's | W |
| - = No Data Reported; -- = Not Applicable; NA = Not Available; W = Withheld to avoid disclosure of individual company data. |
| Release Date: 6/1/2022 |
| Next Release Date: TBD |