|
Download Data (XLS File) |
|
||||||||
|
||||||||
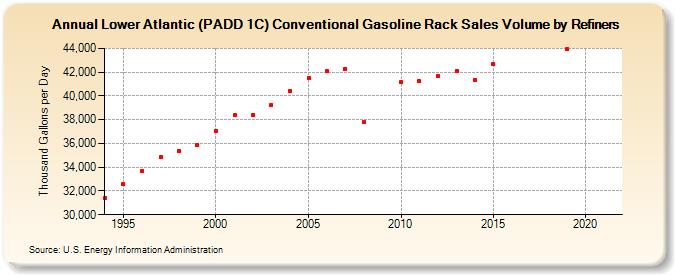
| Lower Atlantic (PADD 1C) Conventional Gasoline Rack Sales Volume by Refiners (Thousand Gallons per Day) | ||||||||
| Decade | Year-0 | Year-1 | Year-2 | Year-3 | Year-4 | Year-5 | Year-6 | Year-7 | Year-8 | Year-9 |
|---|---|---|---|---|---|---|---|---|---|---|
| 1990's | 31,428.8 | 32,548.5 | 33,699.0 | 34,825.8 | 35,368.8 | 35,909.2 | ||||
| 2000's | 37,073.5 | 38,369.0 | 38,416.7 | 39,239.2 | 40,428.1 | 41,544.0 | 42,093.0 | 42,255.9 | 37,767.4 | W |
| 2010's | 41,142.9 | 41,216.1 | 41,670.3 | 42,122.2 | 41,379.7 | 42,678.4 | W | W | W | 43,965.2 |
| 2020's | W |
| - = No Data Reported; -- = Not Applicable; NA = Not Available; W = Withheld to avoid disclosure of individual company data. |
| Release Date: 6/1/2022 |
| Next Release Date: TBD |